Younger Consumers Drive Low-Cost E-Commerce Growth: Temu, TikTok and Shein
Temu, TikTok and Shein are known for their low cost and high product variety: Here is proof that they are primarily used by younger shoppers. But exceptions remain.
eCommerce: Marketplace
Temu's revenue has been growing, but how much? Does Temu really lose US$30 per order? Temu allegedly loses money with its eCommerce platform. Is that true and if so, why?

Nadine Koutsou-Wehling
Data Journalist
October 15, 2024
Other
Halloween is coming up and you might be looking for a funny costume to wear, preferably without spending too much on an outfit you are probably never going to wear again. For many online shoppers, the ideal solution to this problem is Temu: A low-cost platform that offers exactly that. These moments of the year are music to the ears of Temu's managers, who see the company's revenue rising.
Temu is backed by the financial strength of PDD Holdings, enabling the eCommerce marketplace to operate at competitive price levels while allocating a substantial budget to marketing and advertising, even though Temu is not yet profitable. Rumors suggest that Temu loses around US$30 per order. How realistic is this figure?
A WIRED investigation into Temu’s success mentioned that Temu was losing US$30 per U.S. order. We at ECDB did our own calculations and came to the following conclusion.
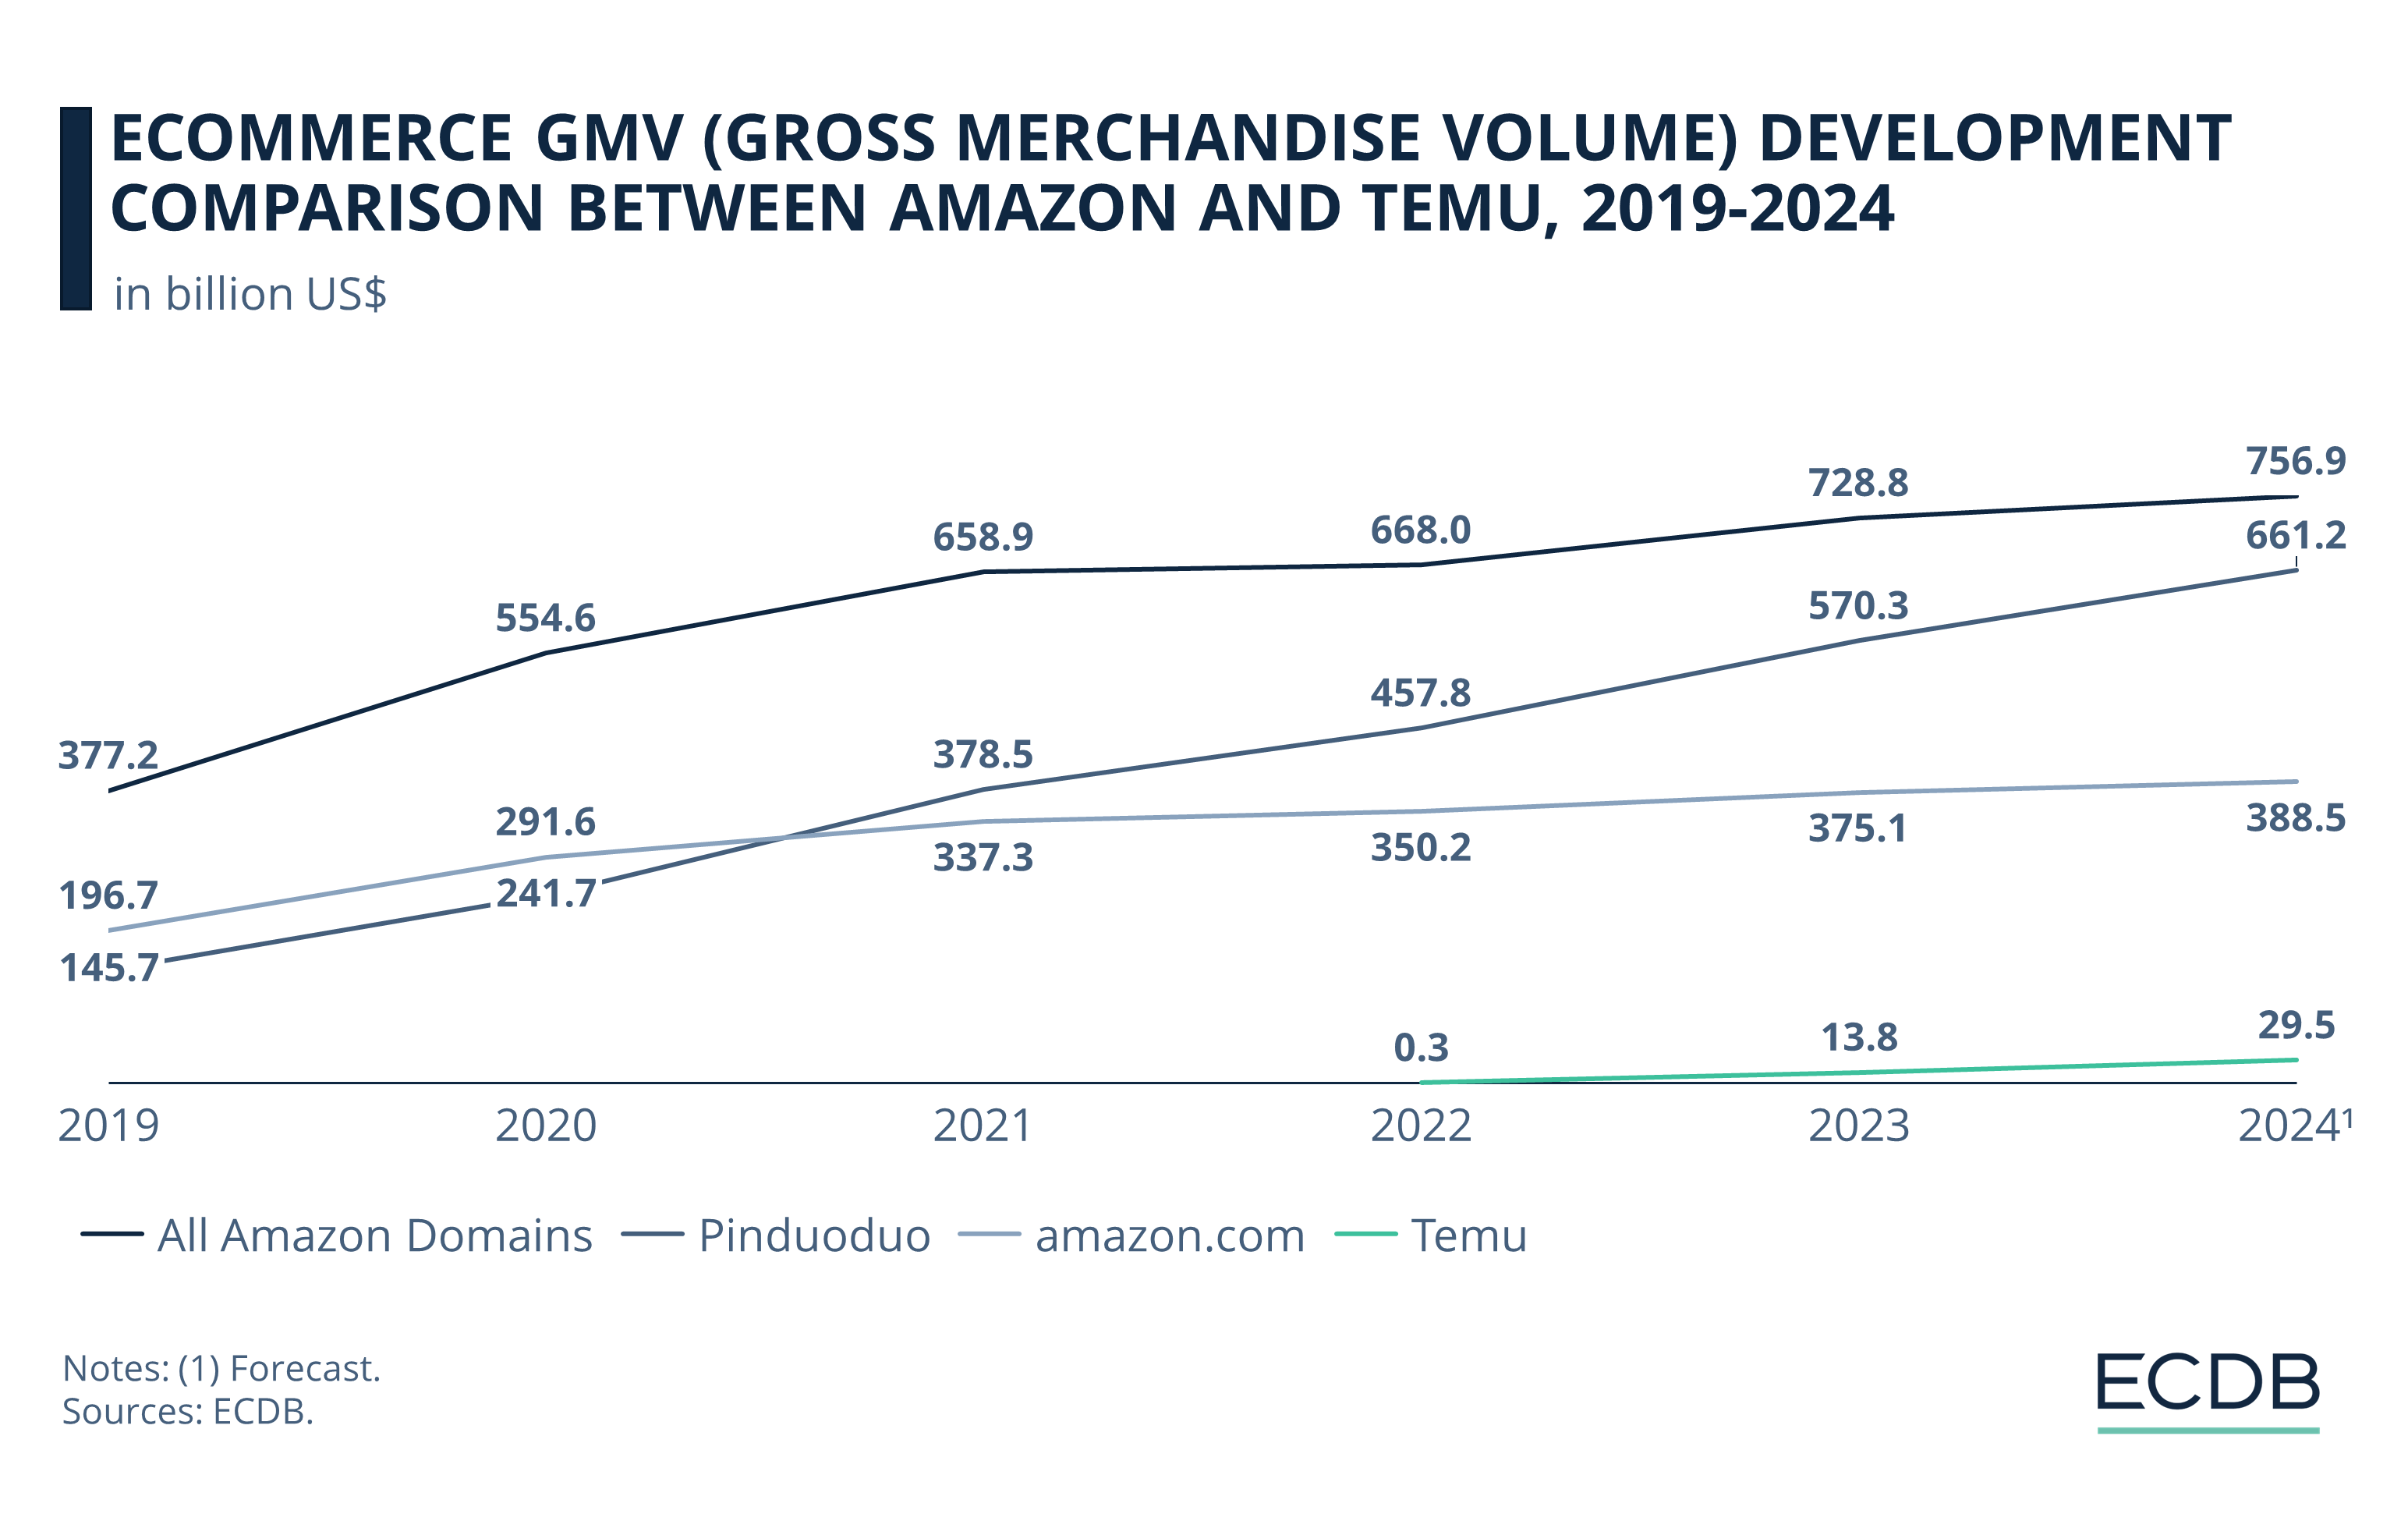
Temu’s worldwide GMV was US$14 billion in 2023, 43.3% of which was generated in the U.S. This equals US$6 billion. Given an AOV (average order value) between US$25 and US$40¹, this means that there were around 150 million and 240 million orders placed in the U.S. in 2023.
In 2023, Temu’s global GMV was US$14 billion, with 43.3% (or about US$6 billion) coming from the U.S. With an average order value (AOV) between US$25 and US$40, this suggests around 150 to 240 million orders were placed in the U.S.
At order volumes of 150 million and US$30 loss, this would mean at least US$4.5 billion would be lost in 2023 in the U.S. alone. This would be equivalent to somewhere between PDD’s total earnings for one to two quarters in the U.S.
PDD's annual report has no room for these massive losses: The segment in the report called "Subsidiaries of PDD," which includes Temu, increased revenue by about US$18 billion between 2022 and 2023, when Temu was launched.
Net income also jumped more than US$5 billion, which does not fit losses of US$30 per order. Since profit rates also remained flat, losses of US$30 on orders up to US$40 do not fit these financials. Costs have increased overall, but not to the extent these estimates suggest.
Marketing, advertising, and customer acquisition discounts have helped Temu build awareness. But the company also has strategies to reduce costs: Merchants must carry the discounts offered on the site, sometimes at no profit. Temu also relies on heavy fines, which sellers say tend to be arbitrary. Customer complaints usually result in Temu withholding payment for items already shipped.
US$30 is the cost of an order, not considering the revenue generated by an order. Because the WIRED piece is from 2023, AOV might have been lower back then, which would mean a net loss of US$5 for a US$25 order. In consequence, the resulting loss would be closer to the number stated in the WIRED article (US$588 million to US$954 million per year).
One could see US$30 per order as customer acquisition cost. Adding costs of conversion such as search engine advertising, targeted marketing, discounts for first time users and general advertising, US$30 would be more realistic as fixed costs per order.
Currently, Temu is gradually rising prices to become more profitable in the long run.
Temu’s main goal is to become the go-to platform that consumers check first when shopping for any product. Backed by Pinduoduo, Temu aims to follow this growth path, leveraging economies of scale as it operates worldwide
However, success is not guaranteed. The fact that national governments are protesting Temu’s unfettered access to protect domestic businesses illustrates the many obstacles Temu must overcome. It is also questionable whether the hype will last, or whether consumers will simply return to the next low-cost platform on the scene, similar to what happened to Wish.
The revenue Temu generates from its platform sales deserves a closer look. Temu operates an eCommerce marketplace, which means that Temu itself does not sell the products, but hosts the infrastructure for sellers.
Gross merchandise volume (GMV) measures the value of goods that were sold on the marketplace during a given period. Temu, as the marketplace provider, makes a profit by charging sellers merchant fees for listing their products on the platform and additional surcharges like advertising.
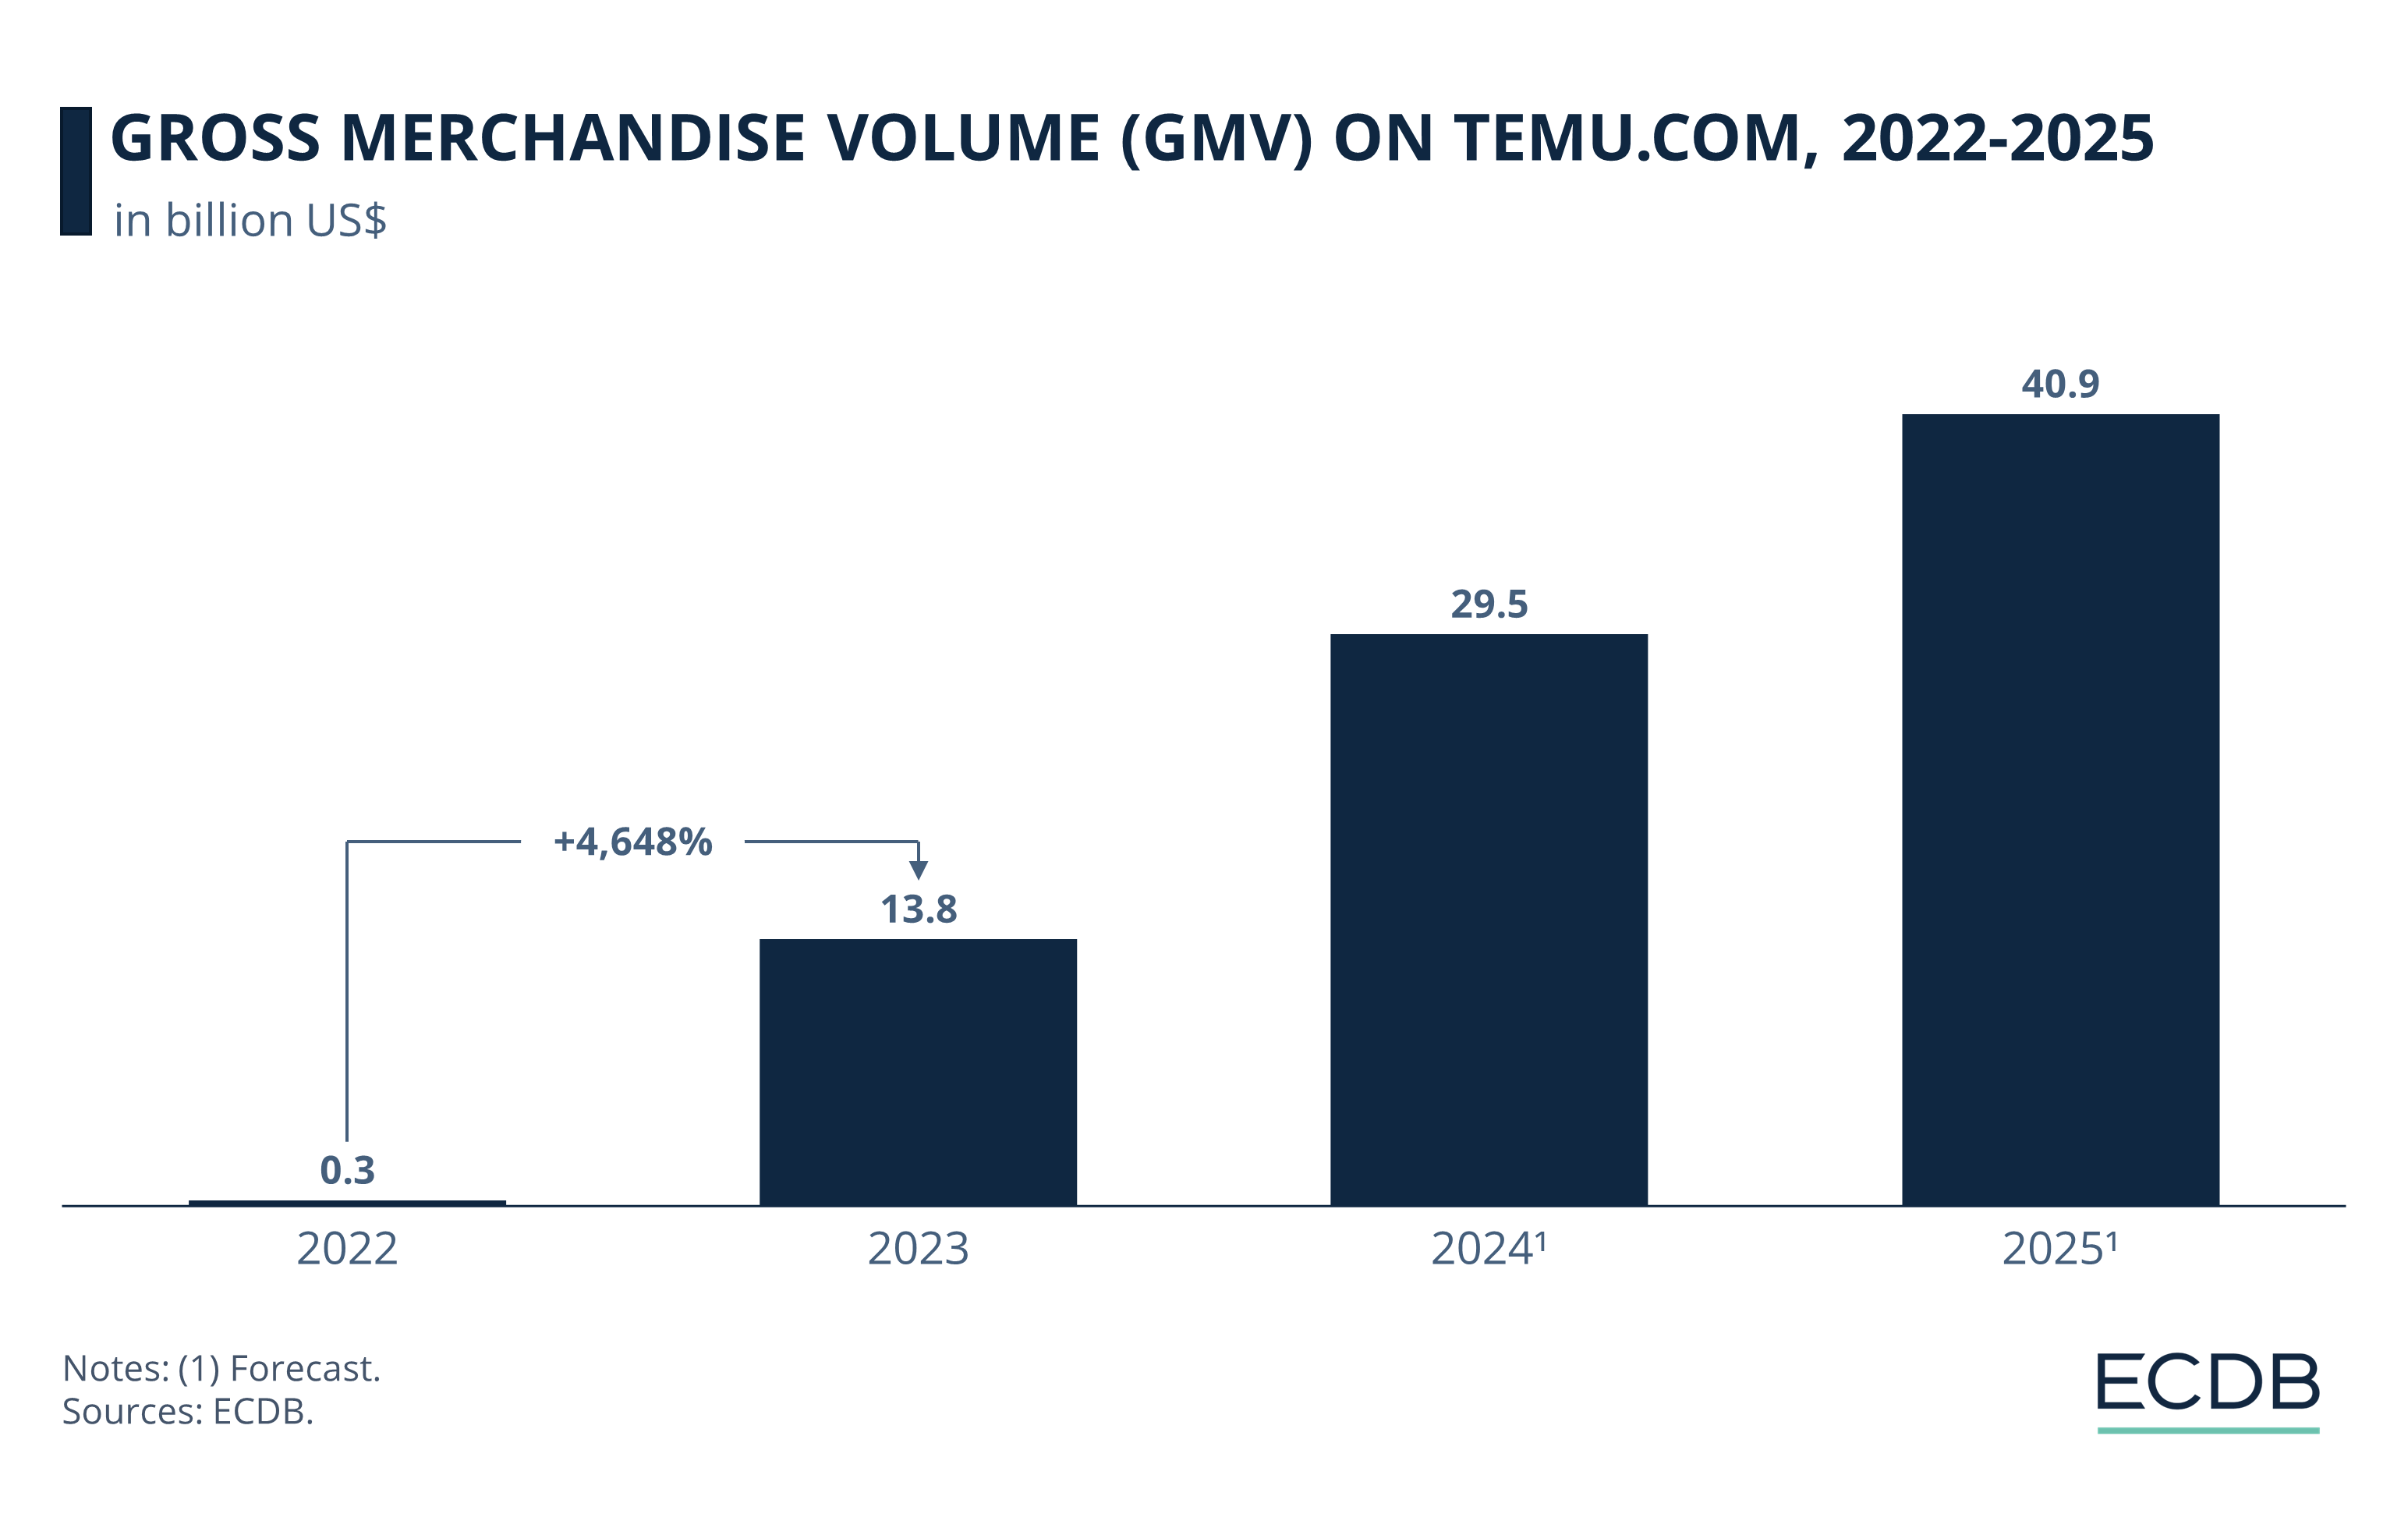
Temu Revenue: 2022 was the year of Temu’s launch. From September to the end of the year, the platform generated a GMV of US$300 million.
Steep Growth: By 2023, GMV had already reached US$13.8 billion.
Estimations: Forecasts for 2024 and 2025 indicate GMV jumps for Temu, with US$29.5 billion in 2024 and US$40.9 billion in 2025.
Temu originated in China and is a subsidiary of the large Chinese eCommerce conglomerate PDD Holdings, which also operates Pinduoduo. Temu’s and Pinduoduo’s strategies are related. They offer a wide range of products at very low prices.
This is made possible by two factors: First, the C2M model. This is a production mode pioneered by Chinese eCommerce players that establishes a direct link between consumer demand and production facilities. The model avoids overstocking and it eliminates intermediary steps such as warehousing, which consume additional resources and time. It is suspected that Temu does random sampling to quality check products. It also fines sellers based on customer reviews.
The second factor is the merchant strategy: Initially, Temu offered merchants the opportunity to sell their products without additional fees, and then gradually increased the fees, which are still lower than industry standards. Because of the sheer volume of merchants and products, even small increases result in high revenue growth.
This strategy uses the reduced costs to offer lower prices on the website. Because consumers are exposed to Temu all over the internet, through advertising, marketing and sponsored search engine and social media posts, shoppers become aware of the low prices soon.
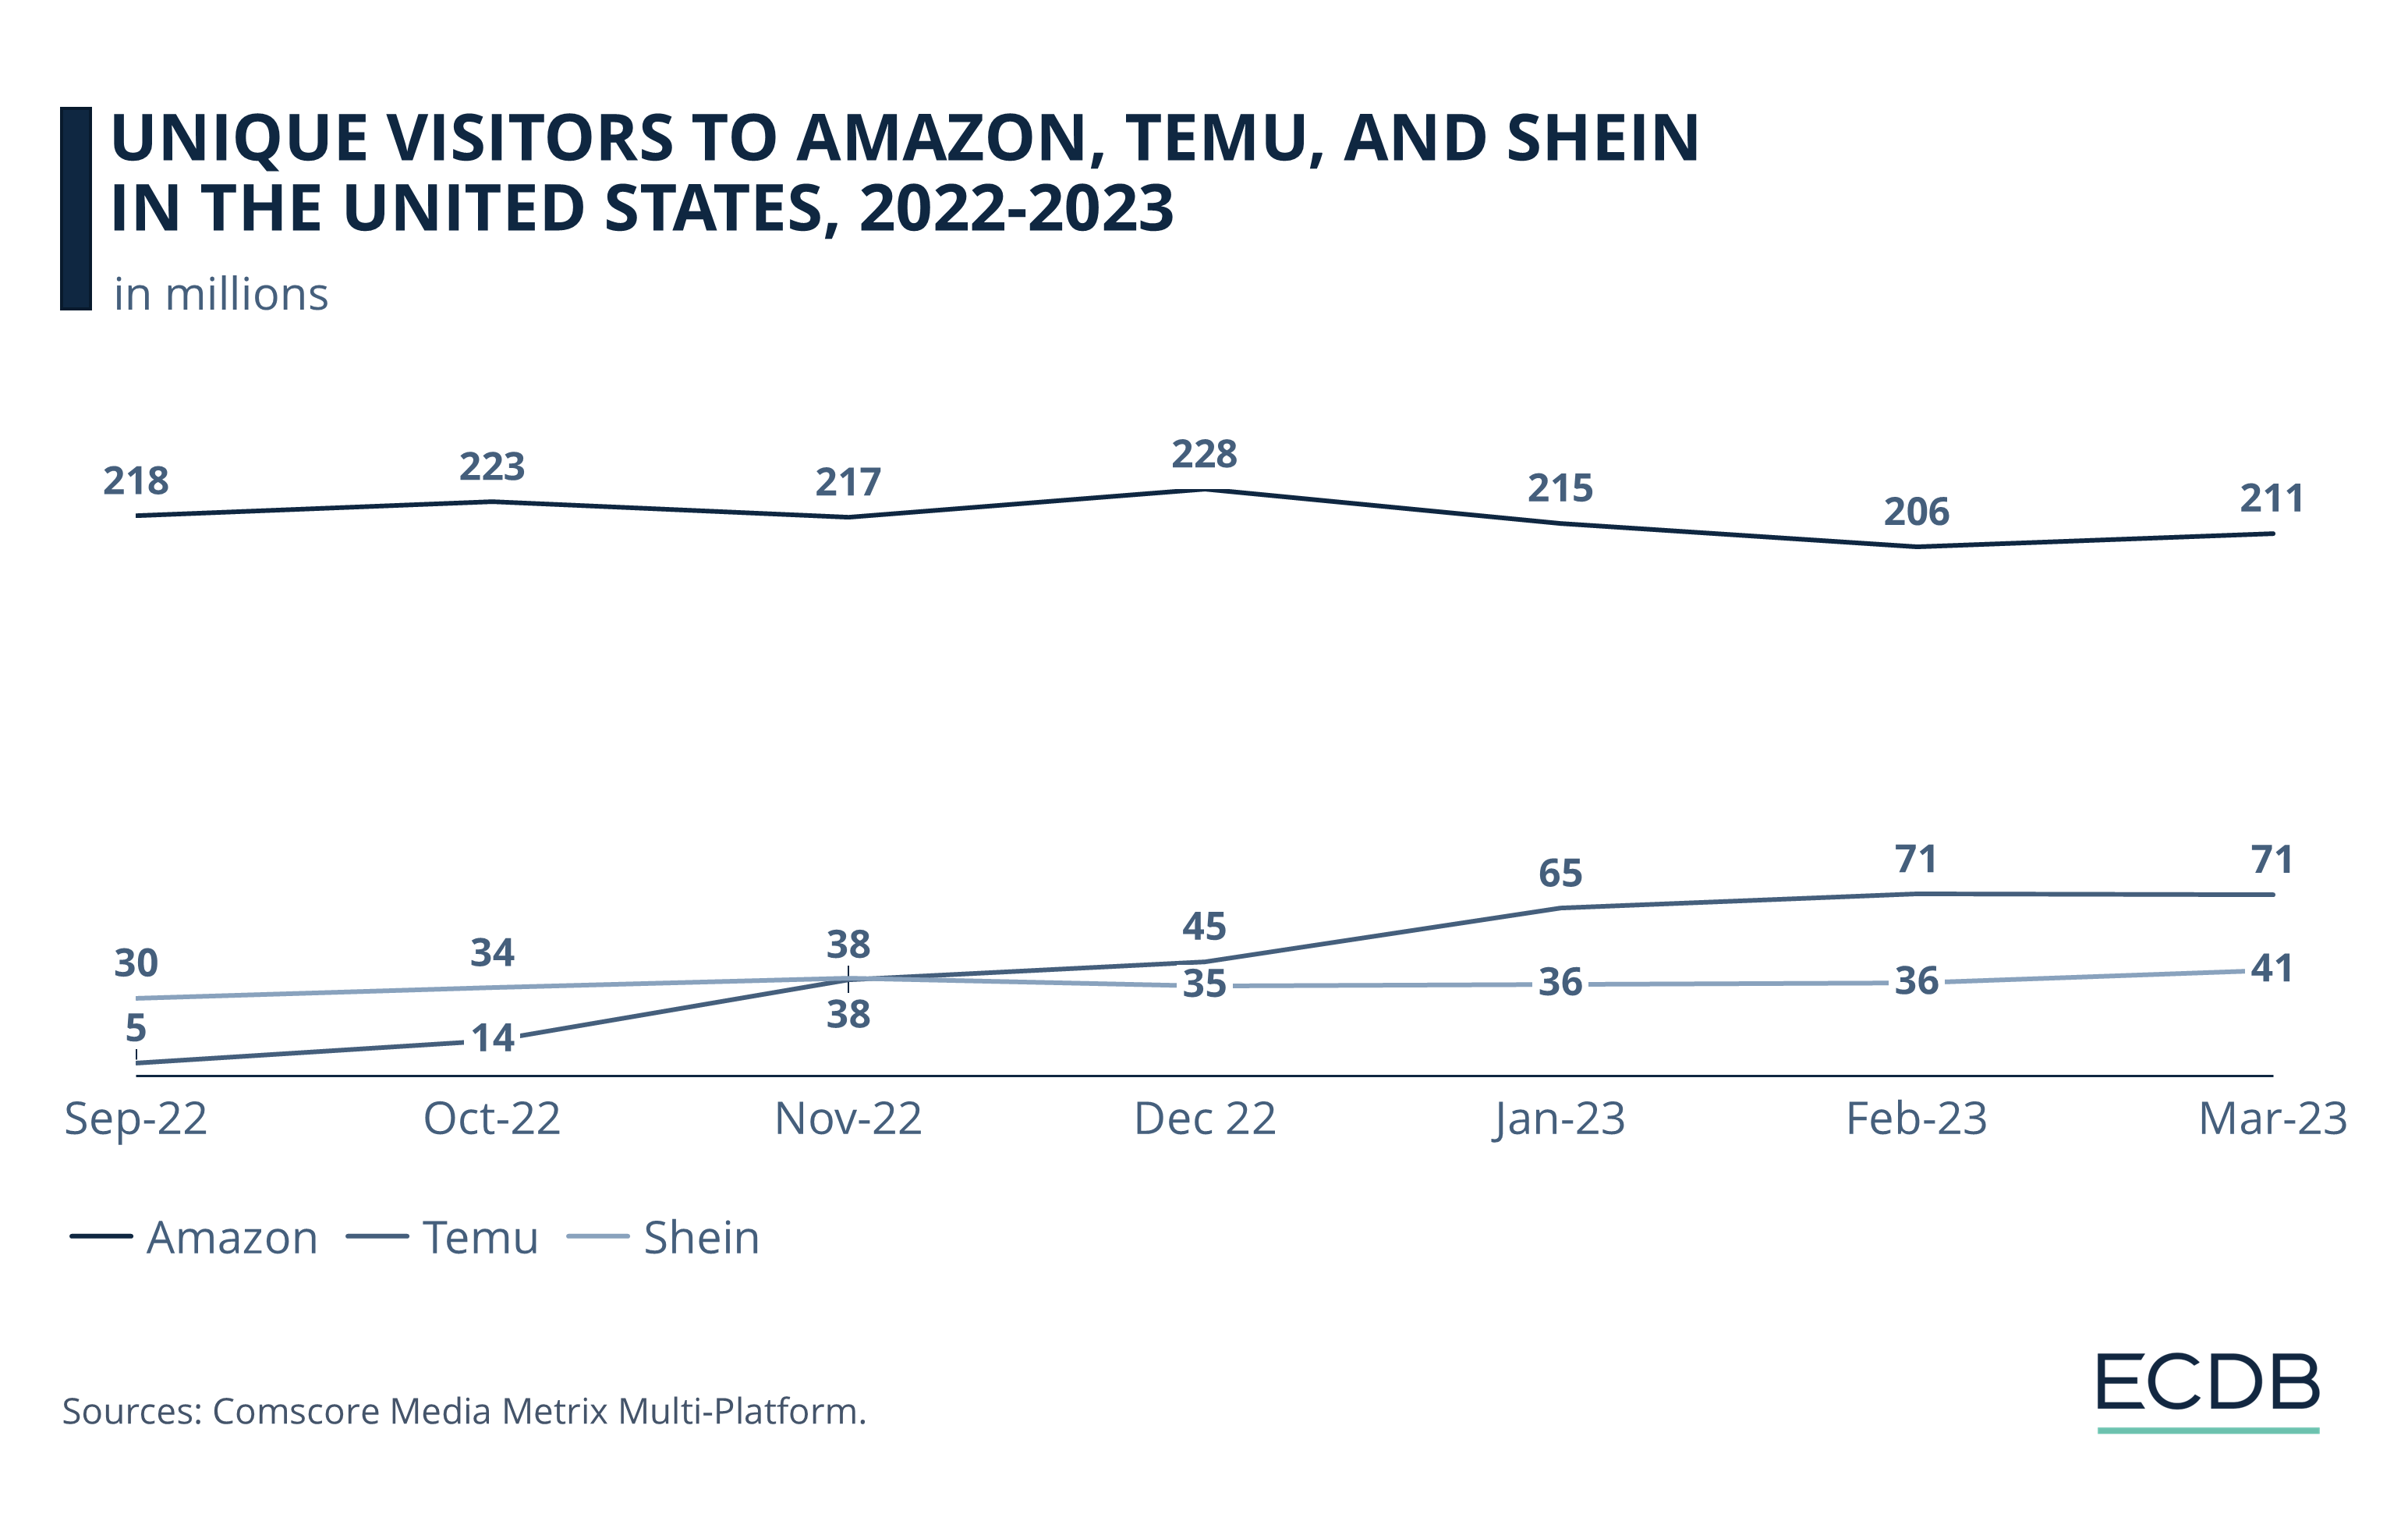
While Amazon is still on top, as the number of unique visitors from September 2022 to March 2023 shows, Temu surpassed its competitor Shein already a few months after its launch:
Now, as awareness grows, Temu is gradually raising prices and moving to a logistics infrastructure that is closer to customers. As governments around the world begin to discuss changes in import regulations, Temu can no longer send many small packages without paying fees.
Temu's revenue has exploded in the few years it has been in business. While its success is based on its backing by one of China's largest technology companies, PDD Holdings, its technological infrastructure and merchant relationships are a solid foundation for further growth.
The US$30 per order losses cited in other publications are only realistic under certain conditions, primarily when viewed as a fixed cost per order. Temu's recent moves to raise prices and use logistics processing in target markets indicate that Temu adapts.
But the distinguishing factor becomes blurry, as prices are increasing. Temu’s notoriety stems from the low prices, so it is not likely consumers will see it as their go-to marketplace anytime soon.

Related Articles
Temu, TikTok and Shein are known for their low cost and high product variety: Here is proof that they are primarily used by younger shoppers. But exceptions remain.
Agentic commerce is a new way of shopping that affects retail platforms and sellers alike and is poised to become the dominant source in product discovery and purchase decisions.
Singles Day 2025 remains the world’s biggest eCommerce event — but mostly in name. While the date 11.11 (Single Day 11.11) gains recognition outside Asia, real participation is still centered in China, where Alibaba, JD.com, and Pinduoduo dominate sales and where live commerce continues to reshape digital retail. Globally, awareness exists — but engagement remains limited.
Click here for
more relevant insights from
our partner Mastercard.
Book a demo to see how ECDB's market intelligence can support your business.