Every other year, Prime Day makes headlines for breaking revenue records. The significance of the shopping day grows with every passing year.
ECDB has the extensive data and analytics capabilities necessary to measure the yearly development of July and October, the months in which Prime Day takes place.
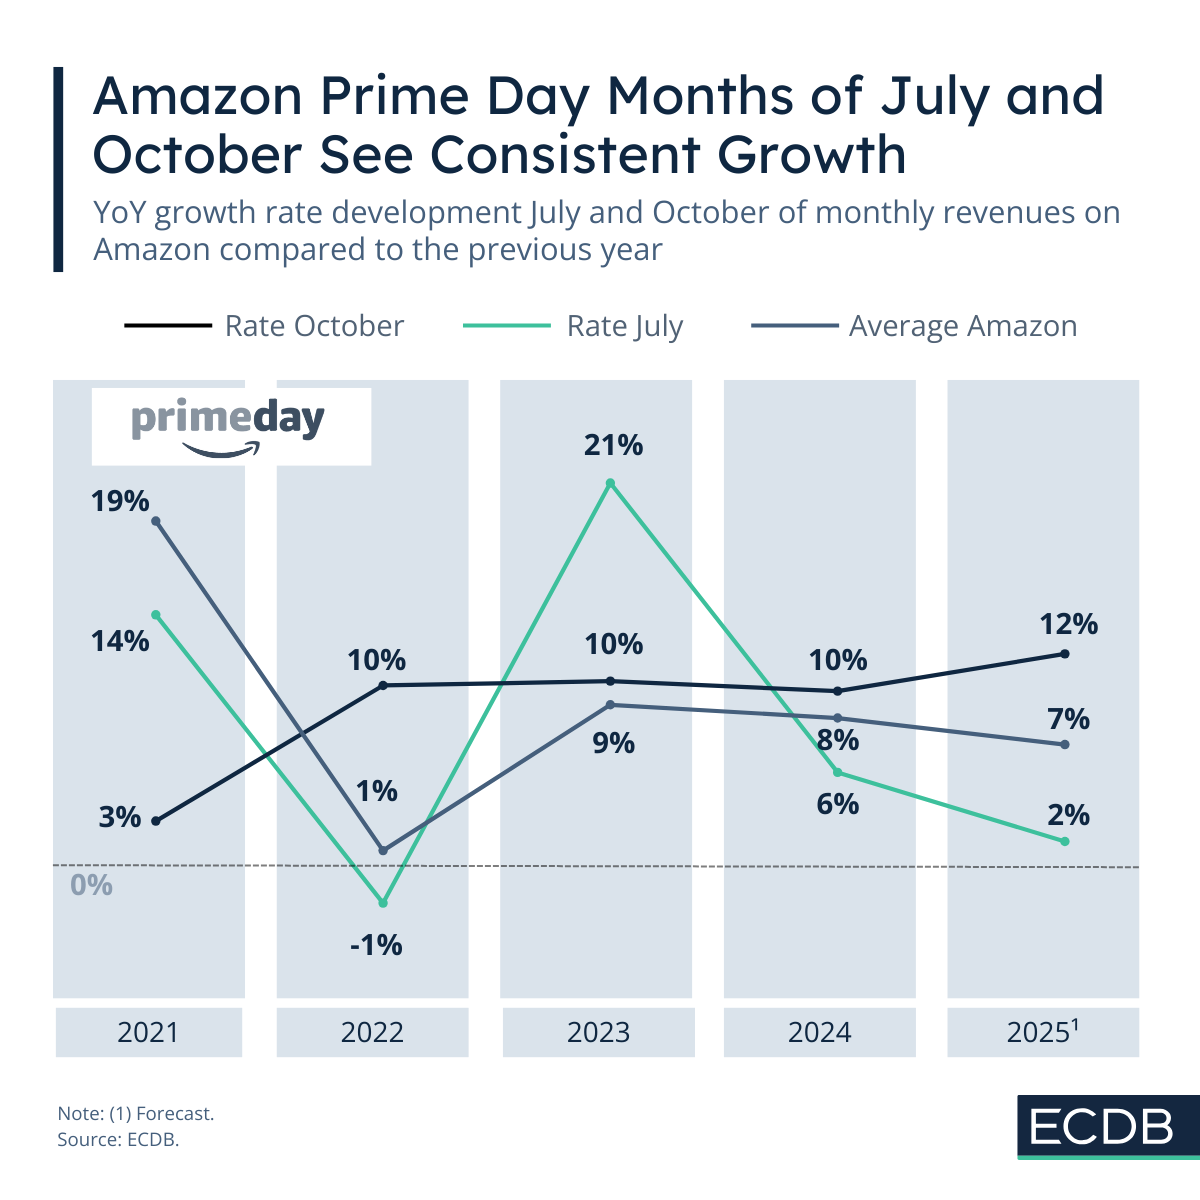
The data shows that July is usually weaker than October, but both months consistently see year-on-year revenue increases.
Prime Day Was Established to Overcome the Summer Sales Slump
Prime Day is Amazon's flagship shopping event. Amazon is a household name in the retail industry. Of course, the concept itself is not new – everyone is familiar with end-of-season sales and the power of discounting.
However, Amazon has benefited immensely from it. The idea originated from Alibaba’s Singles' Day event. It is based on the same principle: Discounting products extensively to attract interest and foster loyalty.
Prime Day attracts new Prime subscriptions and surpassed its original goal of overcoming a summer slowdown, becoming an indispensable contributor to annual revenues.
Usually, Amazon announces Prime Day revenue growth after the fact. The extent of the increase depends on the general economic climate and the previous year's development.
Pandemic Years Were Characterized by Insecurity and Financial Caution
Prime Day received mixed reactions during the pandemic. Overall, from 2020 to 2021, the years were good for business, given the need for online retail solutions and Amazon’s leading position as deliverer of endless products in short amounts of time.
However, it appears that consumers largely chose to participate in one Prime Day event per year. In 2021, July revenues surged 14% from the previous July, but October revenues increased only 3%.
The following year, the trend reversed: October was a stronger month in 2022, with revenues increasing 10% from October 2021. This was preceded by a 1% contraction in July.
The fluctuating success of revenue growth during Prime Day months indicates economic hardship among consumers. Many consumers struggled to make ends meet due to supply chain difficulties and shortages. Ultimately, consumers' choice to participate in one Prime Day and avoid spending money on the other, or to spend a smaller amount, is discernible in the diverging July and October revenue developments for Amazon.
Ups and Downs in Market Environment but Amazon’s Relevance Stays
From 2023 to 2024, monthly revenue growth of the Prime Day months recovered. While the following years saw increases, they were marginal and reflected stagnation more than an incredible sales boom.
For instance, July 2023 saw a 21% revenue increase compared to the same month in 2022. October revenues increased at a more stable rate of 11% year-on-year. This occurred when the economic situation improved slightly after the pandemic.
The following year, 2024, was a shakier time when inflation wreaked havoc on global markets. Here, both July and October revenues increased at more moderate rates than the previous year. While there were still increases, October was more stable with 10% growth, while July was underwhelming with 6%, limited by inflation increases. Ultimately, July's growth rate is expected to fall further in 2025, reaching only 2%.
October 2025 has more stable predictions, seeing a slight improvement in growth with a 12% revenue increase from October of the previous year. October and end-of-year shopping events are generally successful for retail, including eCommerce. This is why Amazon’s monthly revenues in October are less susceptible to decreases, as consumers wait to purchase Christmas gifts and household items.