Discounts are a surefire way to get customers to take a second look at a product they consider buying. Not for nothing do discount events such as Black Friday, Prime Day or Singles’ Day make headlines for breaking sales records year after year.
The big advantage of eCommerce over physical retail is that consumer choices can be closely tracked by data analysis. ECDB offers insights into benchmark KPIs that enable a deeper analysis of the effect of your discounting decisions on related KPIs. How, you may ask? Just take the relationship between discount rates and add-to-cart rates:
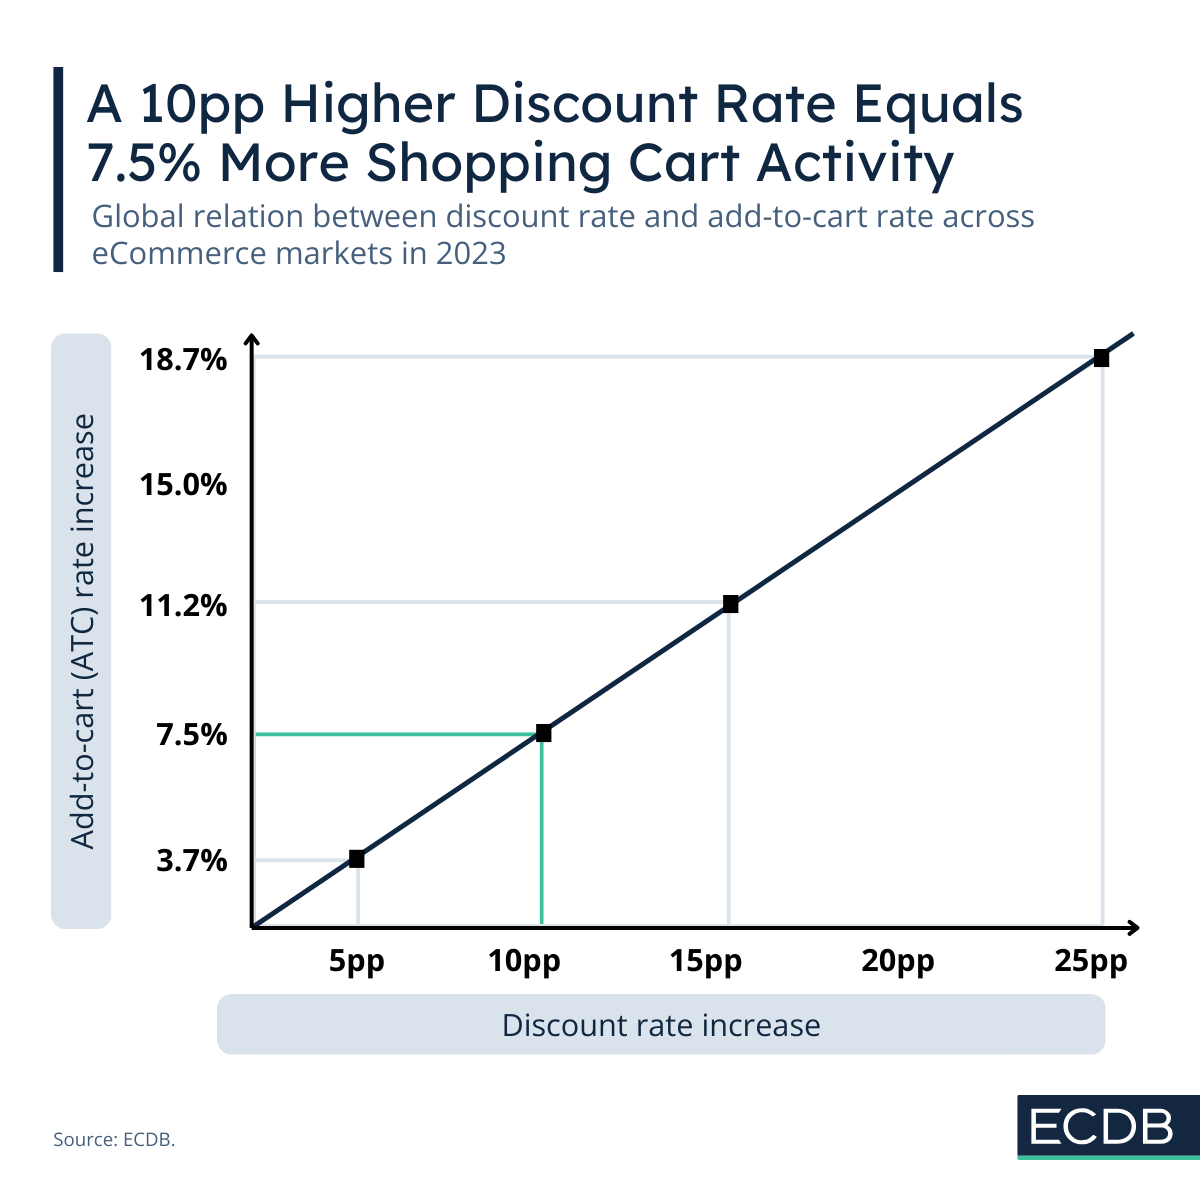
Higher Discount Rates Improve Add-to-Cart Rates
In the thousands of conversion funnel benchmark KPIs that ECDB has collected across categories in global eCommerce, a clear pattern has has emerged in the interaction between the two variables discount rate and add-to-cart (ATC) rate. Intuitively, one would not hesitate to agree that discounts facilitate consumer willingness to add an item to their shopping cart. The hands-on data shows just how true this assumption is.
Raising your discount rate by 5 percentage points (say, from 5% to 10%) leads to an increase of the ATC rate by 3.74%. Logically, the higher your add-to-cart rate, the higher the effect.
On top of that, a higher discount rate correlates with a larger ATC rate increase: A 20-percentage point increase in your discount rate leads to a 14.96% higher ATC rate.
Did you know?
The add-to-cart rate denotes the share of visitors on a website that have added at least one item to their shopping cart during their browsing session.
Take an example retailer x who operates at the global average with an ATC rate of 11.1%. Increasing the discount rate by 10 percentage points would in turn raise the ATC rate by 7.5% to 11.9%. Basically, by increasing your standard discount of 13.8% to 23.8%, now 12 out of 100 website visitors would have added an item to their shopping cart (compared to 11 before that).
Depending on the market in question, standards of benchmark KPIs like discount rates and add-to-cart vary widely. The discount rate and ATC rate in German Fashion eCommerce, for example, are different from those of Bulgarian Consumer Electronics. ECDB has broken down the respective standards across markets. In that way, choosing the right discount rate gets a clear context for weighing the pros and cons.
What’s Next? How to Avoid Cart Abandonment
As you may well know, adding an item to a cart in online shopping does not imply the same intent to purchase as it does in physical retail. There remain other steps in the journey that carry the potential for cart abandonment. The global eCommerce cart abandonment rate was 78.1% in 2023. Does your AOV meet industry standards? What are the most common payment methods in your market niche? ECDB provides personalized answers to your business queries, improving your daily decisions.