Purchase frequency is an important indicator of customer loyalty and provides insight into retailer success beyond a single metric. While revenue analysis in eCommerce is instrumental in gauging retailer success, the important question is how that performance came to be.
One of the most insightful metrics to examine consumer behavior on a platform is purchase frequency. It measures how often a unique user buys products from a retailer in a year.
A high purchase frequency is a good sign, especially in fashion. It signals that users are satisfied with nonessential products. Unlike groceries, which need to be purchased multiple times a month, a high purchase frequency in fashion means that platforms are successfully building loyalty, inspiring repeat purchases, and staying top of mind.
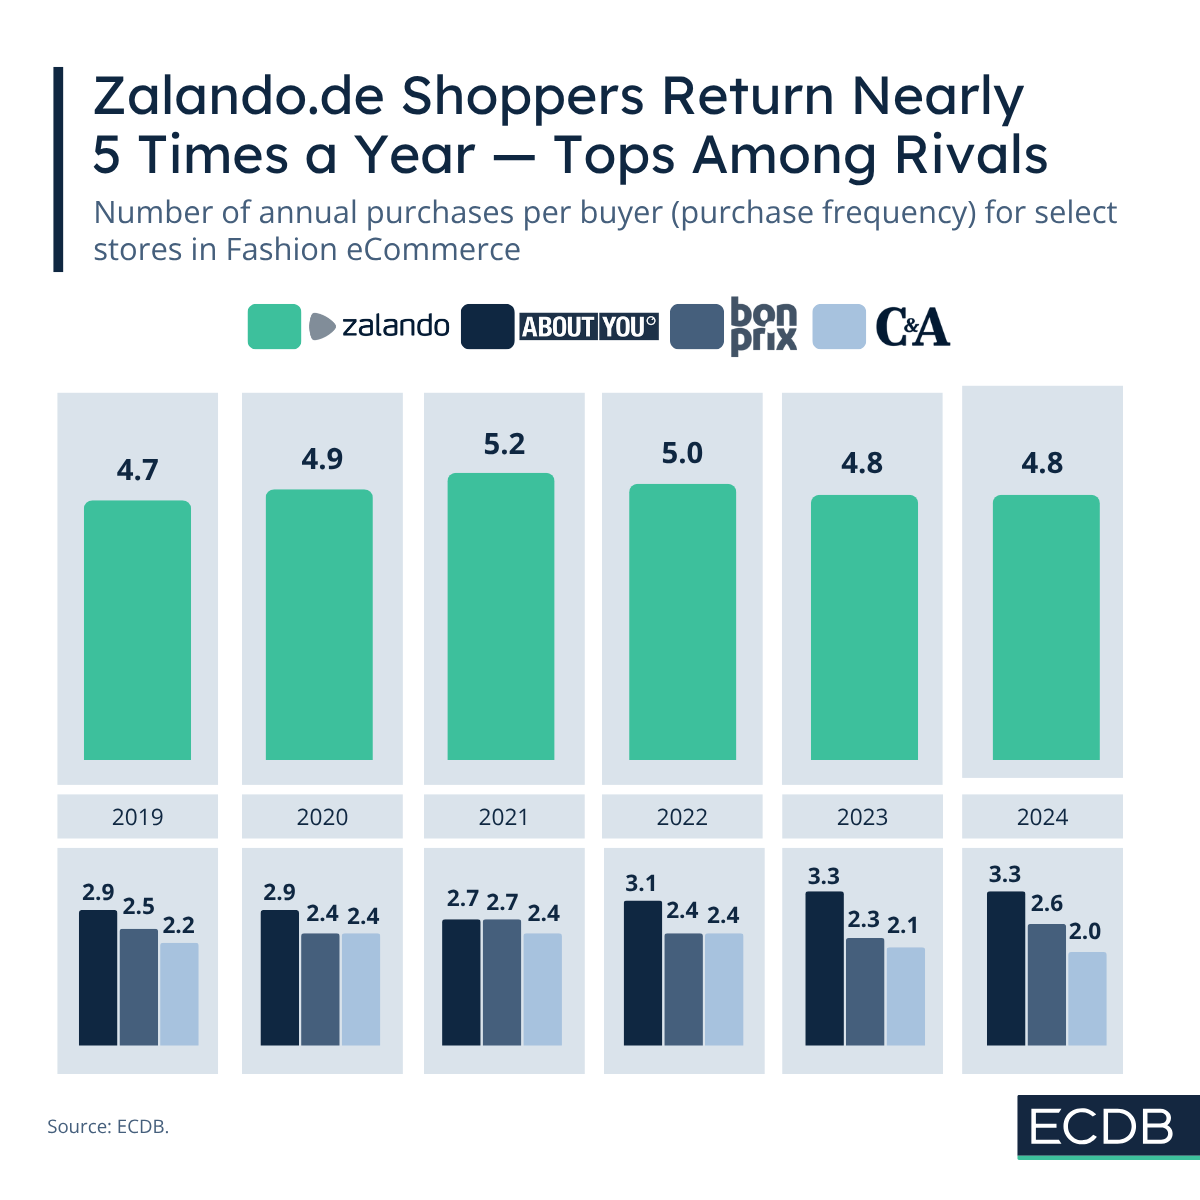
Zalando.de Had a Particularly High Purchase Frequency at an Average of 4.9 Times a Year
Currently, Zalando's approved takeover of rival About You is making headlines. This acquisition will have ripple effects throughout Europe as the two fashion leaders merge and reach more consumers.
Zalando has always been the bigger platform, but About You has a stronger presence in Central and Eastern Europe. Zalando’s advantage is evident in its higher revenue, which is influenced by purchase frequency.
Zalando.de, Zalando’s strongest domain, shows the succession of purchase frequency. Zalando.de experienced ups and downs but maintained an average purchase frequency of around five times, peaking at 5.2 times in 2021.
Five times is a high value for fashion products. As mentioned in the introduction, fashion are nonessential items, with more of a leisurely character for users. At least when they are bought as frequently as they are at zalando.de.
Consumers Bought More on About You Over the Years, at a Lower Level Than Zalando
In contrast, aboutyou.de has seen an increase in purchase frequency since 2019. On average, consumers buy from About You less frequently than from Zalando, but aboutyou.de maintains a decent position in the overall market.
More precisely, About You's purchase frequency rose from 2.9 times in 2019 to 3.3 times in 2024. Competition from Zalando and other platforms with lower prices and similar turnaround times held About You to a lower average purchase frequency. However, other factors should not be overlooked.
Apart from purely quantitative aspects, the user experience and different styles appealing to different consumer segments who are unwilling or unable to buy products more often should be considered.
Compared to similar stores in the market, however, aboutyou.de has a slight advantage. This illustrates how well Zalando performs, with a purchase frequency of almost five times. However, it also shows that consumers usually do not buy fashion products more than three times a year on average.
Competitor Purchase Frequency on the Decline: C&A and Bonprix
Other retailers in the market are on a downward trend; this affects especially homegrown German platforms such as retailer C&A (c-and-a.com) and Bonprix (bonprix.de). C&A experienced a decline in purchase frequency, dropping from a peak of 2.4 in 2020 to 2.0 in 2024.
Bonprix fared slightly better, with a fluctuating purchase frequency that has remained relatively stable since 2019. On average, consumers buy 2.5 times a year on bonprix.de, and the platform noted a frequency of 2.6 times in 2024.
Intensifying competition in the online fashion market contributes to the stagnant performance of second-tier retailers. Although platforms like Bonprix and C&A have loyal customer bases that support their core business, a large number of competing platforms make it increasingly difficult for them to stand out and motivate consumers to purchase fashion items more frequently.
Overall, purchase frequency is a metric that digs deeper into the why of revenue development. Aspects like website appeal, product quality and purchasing power of consumer segments reveal why some retailers thrive where others lag.