The number of orders view is now available in the ECDB tool. Displaying the number of orders adds a level of detail to eCommerce analyses that is unmatched by other data analytics tools.
This feature has several benefits, as it allows users to analyze retailers broadly or compare them to other businesses. It identifies trends over time and the pace at which developments unfold.
As the numbers show, the whole picture matters. It's about the overall level of order numbers, growth rates, comparisons, and reach.
Douyin Stands Out With Order Numbers Over 5 Billion
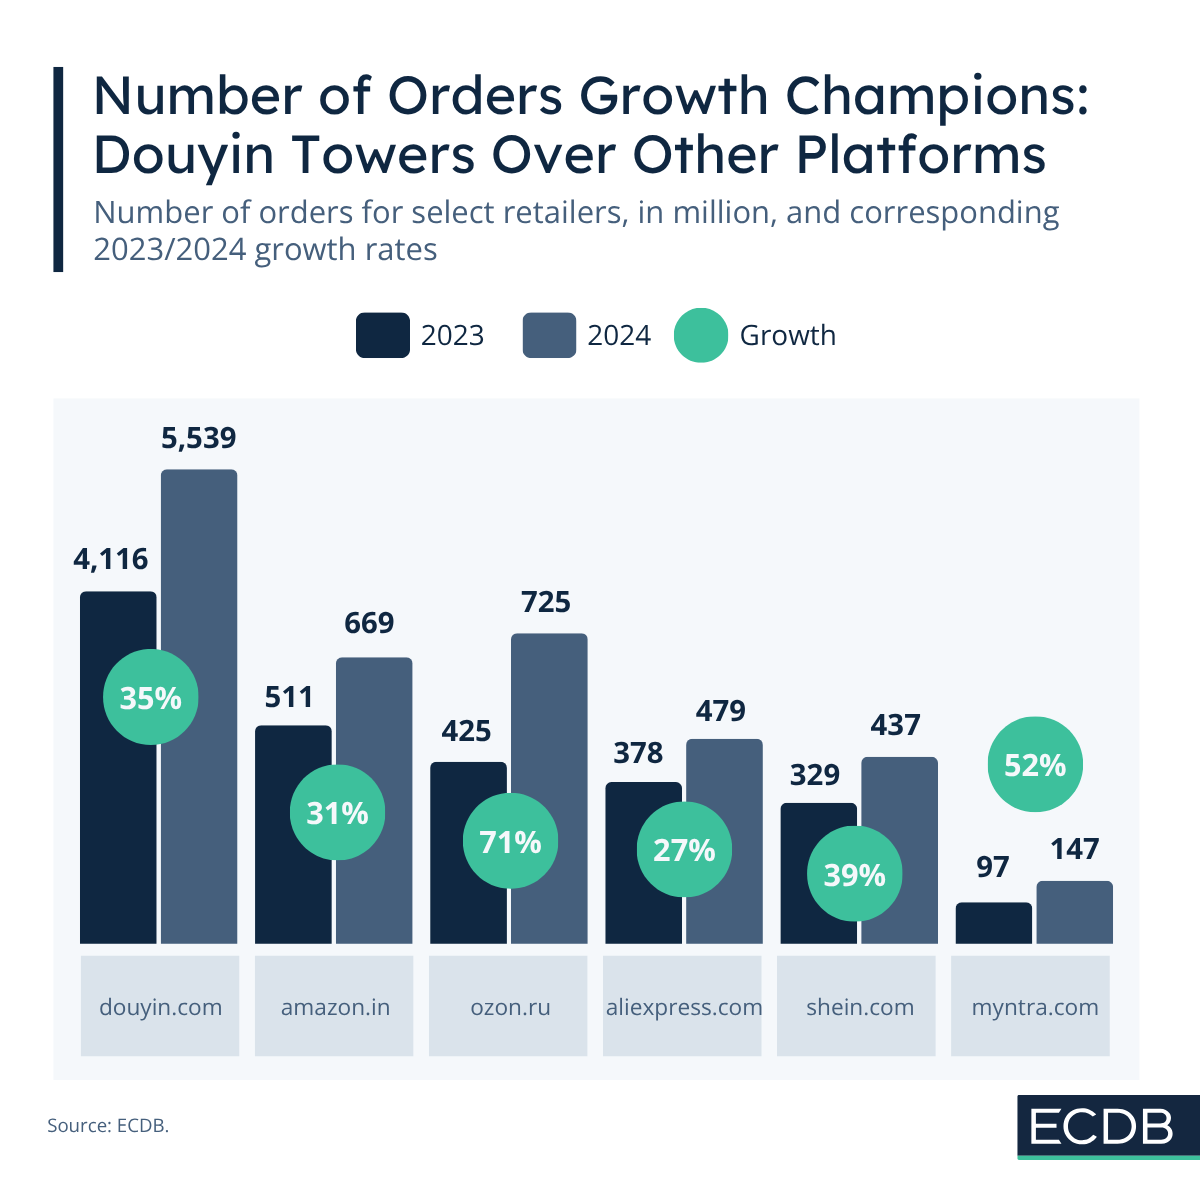
One domain stands out with order numbers reaching multiple billions in 2024: Douyin.com, the predecessor of TikTok Shop powered by ByteDance. In 2023, the platform had over 4 billion orders, which grew to 5.5 billion just one year later.
Douyin.com has surged in recent years, increasing order volume from around 820 million in 2020. The 1 billion threshold was surpassed in 2021.
This demonstrates how quickly Douyin gained popularity and why the launch of TikTok Shop led to the assumption that the platform could take off in a similar manner. However, this prediction has not yet come to fruition.
A Comparison in the Same Region: Amazon.in vs Myntra
Amazon’s Indian domain, amazon.in, saw 31% growth, increasing from 511 million to 669 million orders in 2024. This beats Walmart’s subsidiary company Myntra, which grew steadily at a rate of 52%, but with much lower order numbers, reaching 147 million in 2024.
Amazon celebrated the 10-year anniversary of its Indian domain in 2023. With its large logistics network and competitive strategy, the retailer continuously improves its standing in Indian eCommerce, which is one of the most promising regions for growth right now.
Ozon.ru Thrives Due to Contemporary Circumstances
Ozon.ru had the highest growth rate among the selected retailers. It increased its order numbers by 71%. At a moderate level of 425 million orders in 2023, orders on ozon.ru grew to 725 million by 2024.
The Russian platform is thriving because the impact of foreign marketplaces is limited due to trade restrictions. As consumers turn to domestic platforms for their purchases, ozon.ru grows accordingly.
International Growth on AliExpress and Shein
Beyond these regionally focused platforms are those with an international portfolio of operating markets. These include aliexpress.com and shein.com. Both platforms have a similar number of orders, around 450 million in 2024. However, Shein has experienced a steeper rise than AliExpress, which has been operating for a longer period of time with a more gradual increase in recognition, trust, and number of orders.
The number of orders view emphasizes, ultimately, that AliExpress is on par with the other platforms that have generated buzz and headlines due to their explosive rise in recent years. AliExpress has operated at a similar level but has crept up silently from behind, going long unnoticed or underestimated.
How Number of Orders Sharpens Your eCommerce View
The number of orders view adds another layer to the eCommerce analysis. To paint a full picture, focusing on one indicator alone is not enough. With this view, users can go beyond revenue or traffic figures and gain insight into how platforms actually perform in terms of volume.
As shown in this article, number of orders can be used to assess retailer development, compare similar retailers or gauge their performance and standing in a market. With the ECDB tool, you will stay ahead of the curve by identifying trends before they fully form.