Growth trends are a popular topic in eCommerce, and globally, the outlook is mostly positive. But what if we factor in inflation? In recent years, inflation dominated headlines—only to quietly fade from the spotlight.
But the lack of coverage on inflation doesn’t mean it is absent from the global economy, or eCommerce, for that matter. Quite the contrary: adjusting nominal growth rates for inflation yields the real growth rate, which reflects the rise in purchasing activity if prices had remained unchanged from the previous year.
Here is what this means for real growth rate over the past few years.
High Nominal Growth and Low Inflation: High Real Growth Until 2021
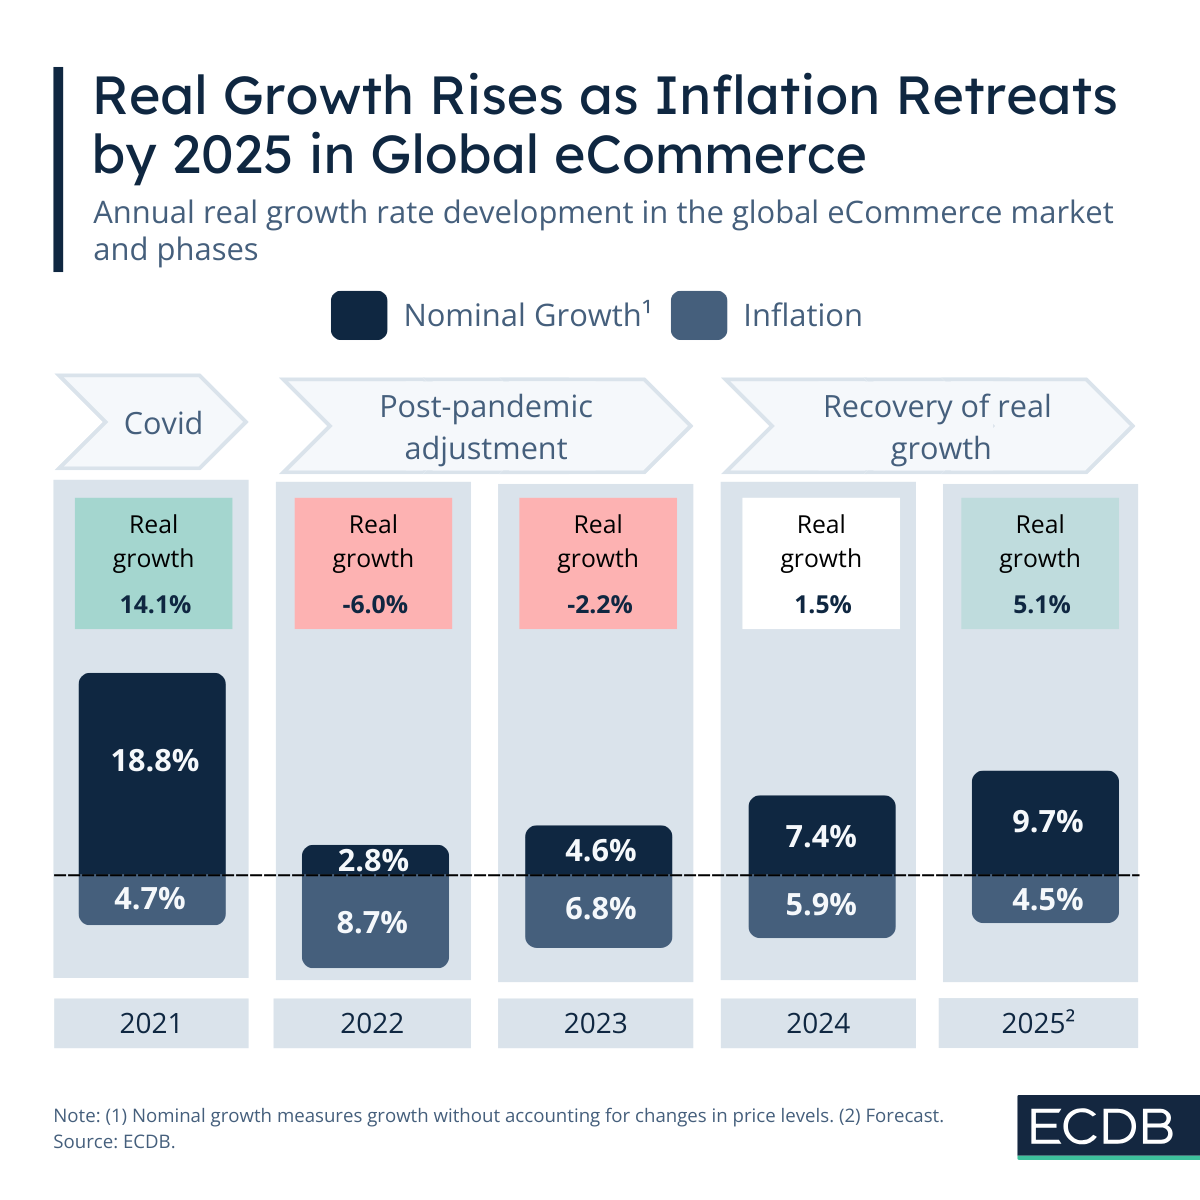
Throughout the pandemic up to 2021, inflation has not been much of an issue, hovering around 3%. This means that prices increased by about this rate from the previous year. In 2021, this value increases slightly, resulting in an inflation rate of 4.7%. Adjusting the nominal growth rate of 18.8% for inflation results in a real growth rate of 14.1%: The level of purchase increase as if prices remained the same as the previous year.
This pattern is typical for the pandemic years. It reflects the unrestrained growth in demand for online products: High nominal growth meets low inflation.
Low Nominal Growth and High Inflation: Falling Real Growth in 2022 and 2023
Inflation began to plague global eCommerce in 2022: physical stores reopened and bottlenecks in the supply chain pushed up price levels, exacerbated by pent-up demand for goods and resources. As a result, product prices rose at an unusually high rate, reaching an inflation rate of 8.7% in 2022 and 6.8% in 2023.
Combined with the low nominal growth rate of global eCommerce, which was driven by consumers returning to physical stores and the fading of pandemic-era surges, high inflation led to negative real growth. As a result, the sharp peaks of the pandemic were offset and the rapid growth of those years was balanced out.
Rising Nominal Growth and Declining Inflation: Recovering Real Growth Since 2024
In the present tense, real growth entered its recovery phase in 2024, and the outlook for 2025 expects this process to gain momentum. This is because nominal growth increased while inflation has subsided. More precisely, nominal growth of 7.4% met inflation of 5.9%, resulting in small, but positive real growth of 1.5%.
The outlook for 2025 is for real growth of 5.1%, derived from nominal growth of 9.7% and subtracting inflation of 4.5%. It is fueled by worldwide expansion of eCommerce in mature and emerging markets alike, reflects the growth of innovations that incentivize consumers to buy products online and the progress of eCommerce players catering to increasing demand.