Why Global E-Commerce Is Growing: Buyers and Frequency
Global e-commerce revenues reached US$4.89 trillion in 2025 and are projected to surpass US$5 trillion by 2026. The ECDB Revenue Equation shows what is fueling this growth.
Monthly E-Commerce Wrap-Up
January e-commerce sees slowing revenues from holiday peaks, but some markets are still ahead of others. Find out all about the specifics.

Nadine Koutsou-Wehling
Data Journalist
February 03, 2026
Market Trends

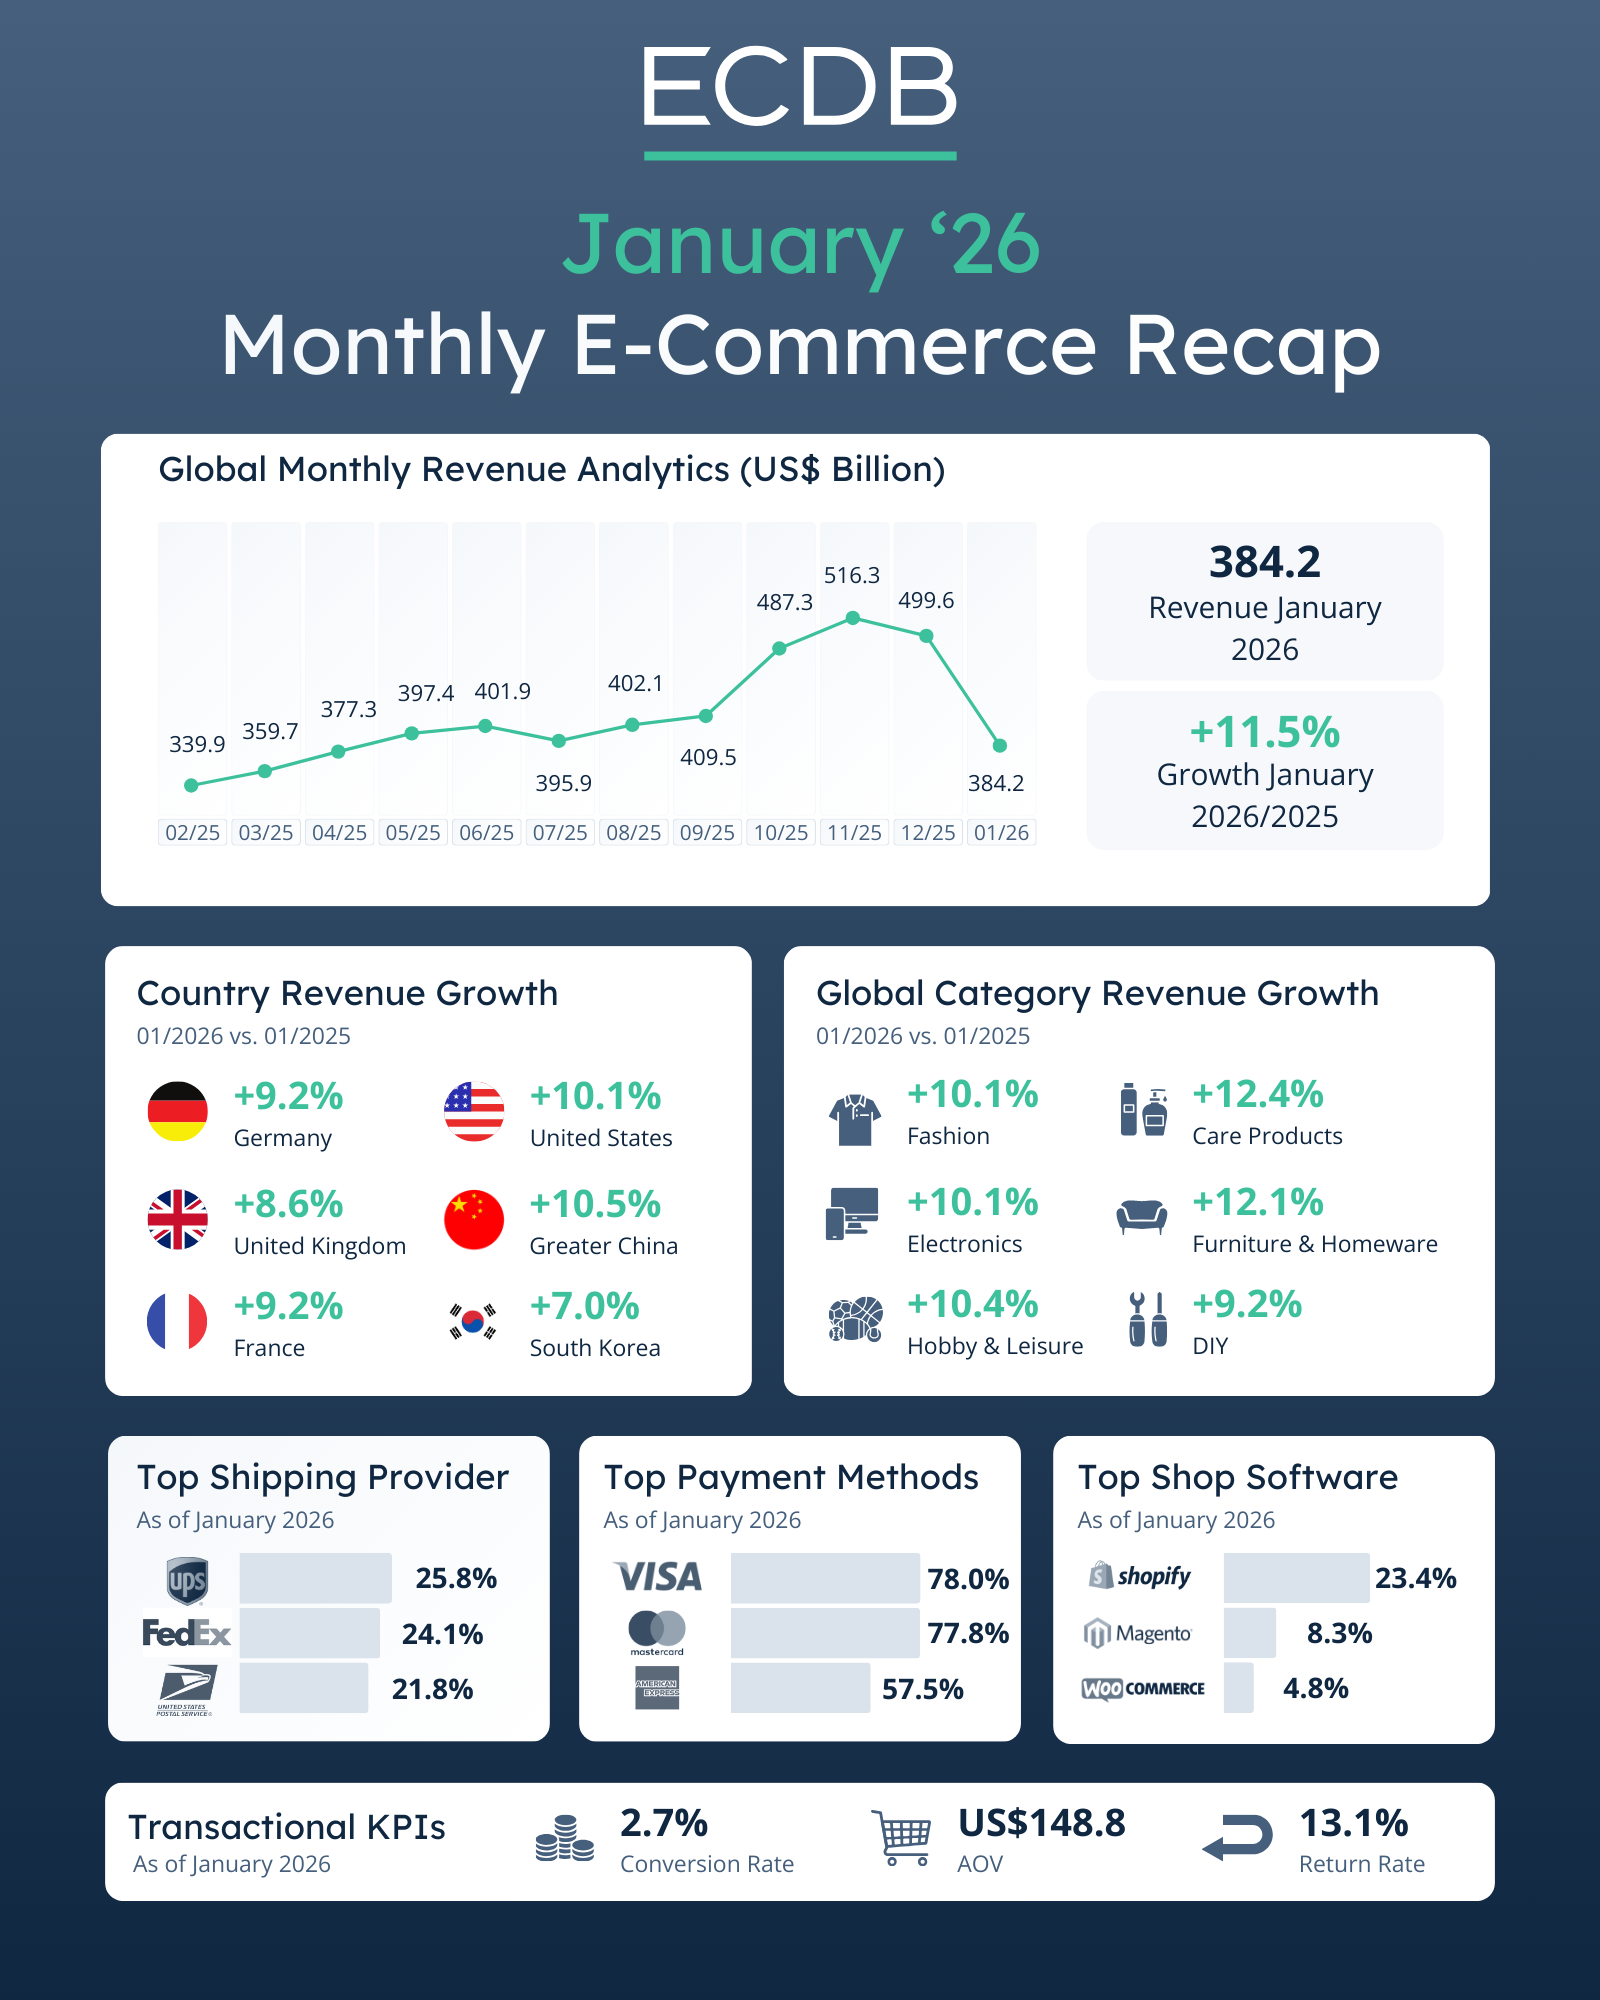
One year has passed, and the monthly recap is back in a new format. January set a tone for what's ahead with global e-commerce revenues reaching US$384.2 billion. This marks a slowdown from the previous holiday peak, but is still up 11.5% from January in 2025.
Revenue growth was led by two major markets:
The United States, with a 10.1% increase, and
Greater China, close behind at 10.5% growth.
Other regions followed at a slower pace. South Korea, in particular, lagged behind the global average with a 7.0% year-on-year revenue increase.
In terms of product categories, Care Products stood out as the fastest-growing segment, with 12.4% growth, closely followed by Furniture & Homeware at 12.1%.
The DIY category also expanded, though at a more moderate pace of 9.2%.
When it comes to fulfillment, a few global players continue to dominate online retail logistics:
UPS leads with an online store penetration of 25.8%
FedEx follows at 24.1%
USPS ranks third with 21.8%
Alongside shipping, we’ve also included a snapshot of the leading providers in payment solutions and shop software, offering a broader view of the e-commerce infrastructure powering global online sales.
Related Articles
Global e-commerce revenues reached US$4.89 trillion in 2025 and are projected to surpass US$5 trillion by 2026. The ECDB Revenue Equation shows what is fueling this growth.
Mature markets often dominate headlines, but early-stage markets represent untapped potential. The numbers show why they should not be overlooked.
In February, global e-commerce reached revenues of US$370.1 billion, marking a further decline from the previous month. But in a year-on-year perspective, February 2026 revenues weren't so bad at all. Here are the details.
Click here for
more relevant insights from
our partner Mastercard.
Our Tool
We’re not just another blog—we’re an advanced e-commerce data analytics tool. The insights you find here are powered by real data from our platform, providing you with a fact-based perspective on market trends, store performance, industry developments, and more.
Analyze retailers in depth with our extensive Retailer dashboards and compare up to four retailers of your choice.
Learn MoreCombine countries and categories of your choice and analyze markets in depth with our advanced market dashboards.
Learn MoreCompile detailed rankings by category and country and fine-tune them with our advanced filter options.
Learn MoreDiscover relevant leads and contacts in your chosen markets, build lists, and download them effortlessly with a single click.
Learn MoreBenchmark transactional and conversion funnel KPIs against market standards and gain insight into the key metrics of your relevant market.
Learn MoreOur reports provide pre-analysed data and highlight key insights to help you quickly identify key trends.
Learn MoreFind your perfect solution and let ECDB empower your e-commerce success.