What is your favorite pastime after hours? If you like to engage in gardening, your hobby may literally be on ice right now. Online shopping usually follows seasonal trends, which means that revenues are higher in some typical “eCommerce months”, while others are less typical. The global Garden online market is the same: Because the demand for barbecues, gardening accessories and plants & seeds depends very much on the weather, revenues fluctuate accordingly.
Online Demand for Garden Products Is Highest in April and May
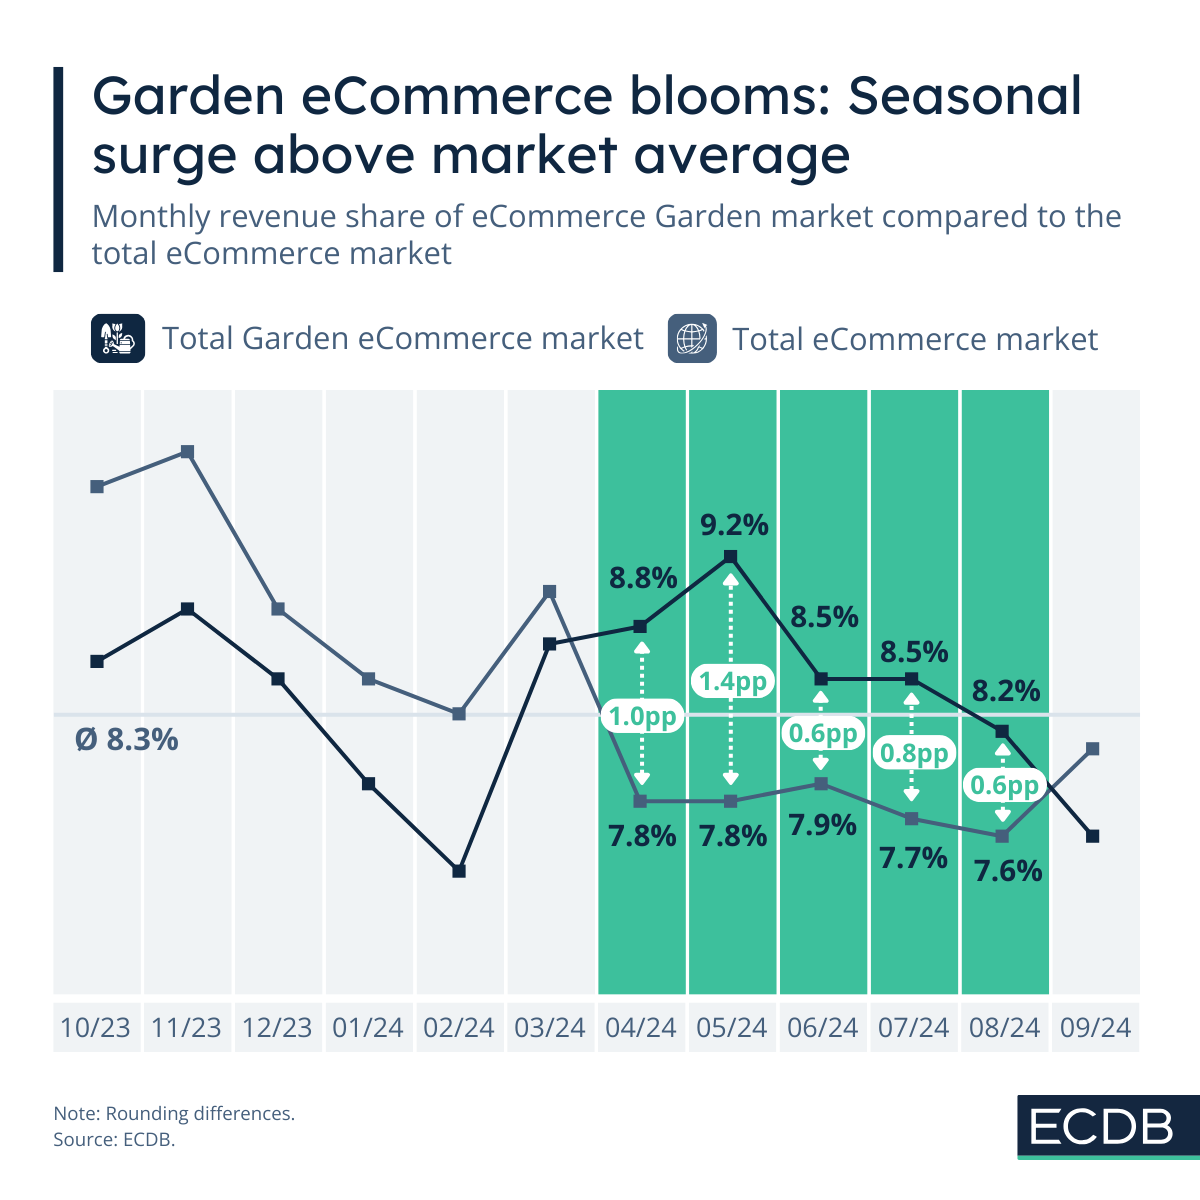
Compared to the monthly revenue shares of the global online market, Garden products generate revenues that are inverse to the overall market. This means that in the months when eCommerce tends to slow down in general terms, which is usually during the summertime, online Garden products have their heyday. The highest monthly revenue shares occur in April and May, but June, July and August are also above average of the global eCommerce market.
This is because gardening is mostly a fair-weather activity. In the ECDB market definition, the category includes barbecues (grills, smokers and grilling accessories), gardening accessories (soils, pots, fertilizers, tools, barrels, greenhouses and compost bins), and plants & seeds. Given the fact that seeds are usually planted in springtime, and barbecuing is also a seasonal activity, the demand for these products diminishes during fall and winter.
A Silver Lining: Online Garden Shares Increase Slightly in October and November
While online demand for Garden products is lower than the overall market’s in the colder months, market shares do increase in October and November. The reason behind that: Shopping events and the holiday season. Given the occurrence of Prime Day, Singles’ Day, Thanksgiving Weekend and Cyber Week, consumers make use of the discounts to buy the products they have been eyeing all year. They also make for good holiday gifts.
Another factor that plays into the higher revenue shares during October and November are Garden products that are seasonal in fall like poinsettia, mistletoes, and, of course, Christmas trees. In addition to that, greenhouses allow for year-round gardening.
Outlook: Steady Growth of Garden Online Products
The seasonality of Garden products is not expected to change, but its global market revenues are forecast to continue growing positively. Market revenues are at US$44.4 billion in 2024 and are projected to reach US$69.0 billion by 2028. This is because providers for these categories increase, and consumers are more accustomed to buying Garden products online. The prerequisite for success in the market is, as always, based on convenience and a more favorable offering to physical retail.


