Article in a Nutshell:
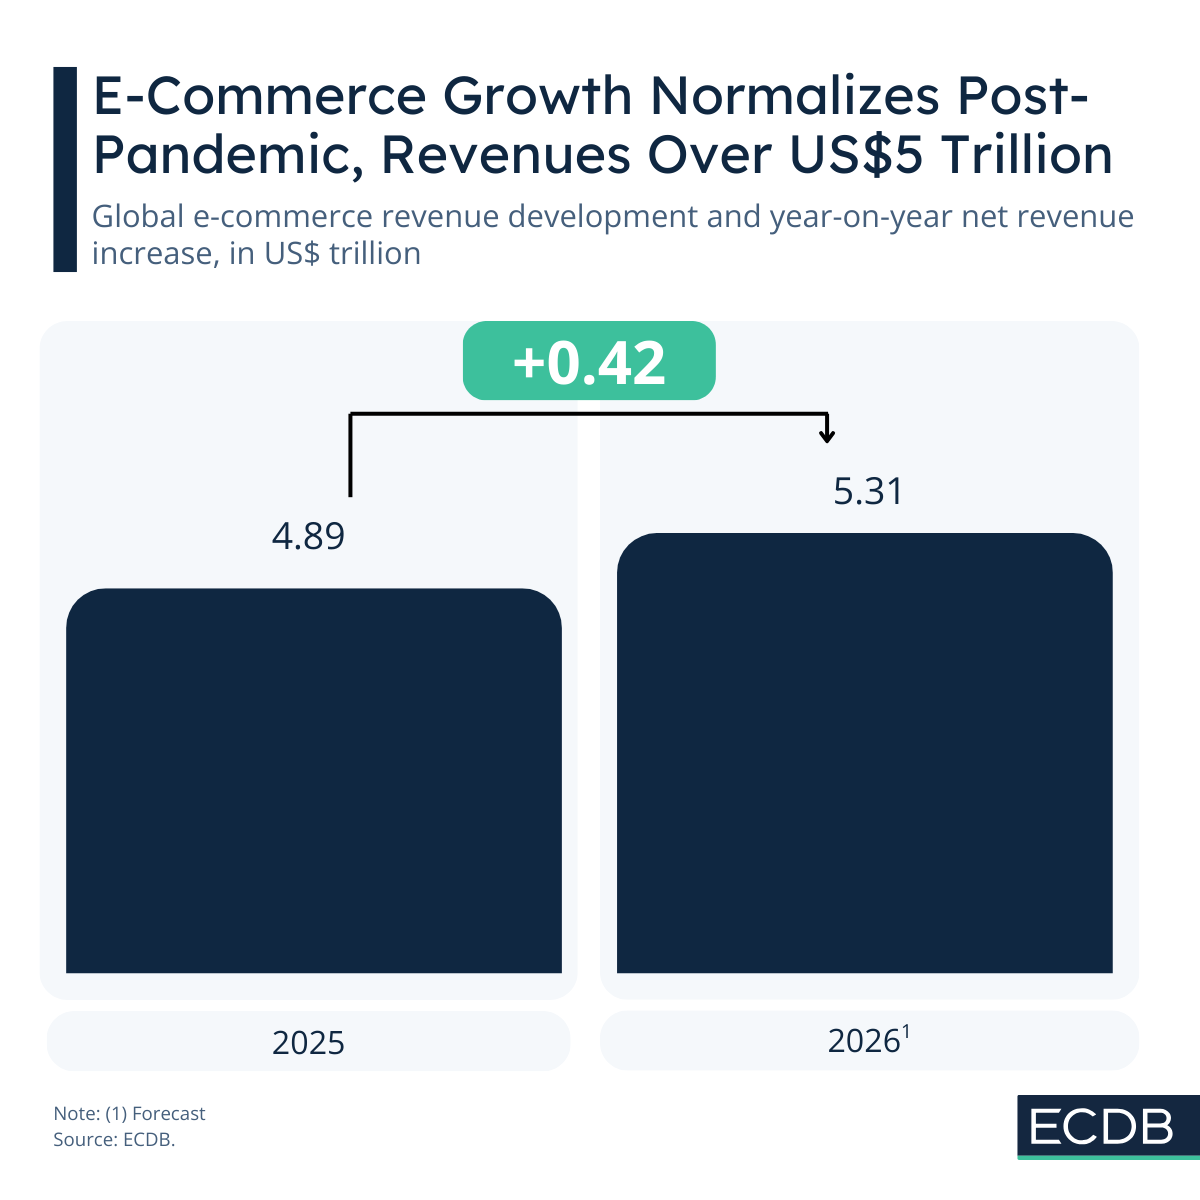
Global e-commerce surpasses US$5 trillion in 2026, with net growth of US$421 billion driven by a few leading markets and players.
Greater China leads growth: The e-commerce leader contributes US$175 billion (42% of net growth).
Top three countries dominate: Together, China, the US and the UK account for 64% of global e-commerce growth.
Platform concentration is slightly lower, as Pinduoduo, TikTok (Douyin), and Amazon together capture nearly 40% of new revenues.
The global e-commerce market has regained momentum. But growth is centered around a few leading players. Breaking down net growth by contributor reveals that a small group of countries is driving the market forward, while the rest lags.
Net Growth in 2026 Amounts to US$421 Billion
In 2026, global e-commerce surpassed the US$5 trillion threshold. The increase from 2025 marked US$421 billion, driven by contributions of various markets and players.
The leading markets and players reveal how concentrated e-commerce is becoming, given that the largest capture a majority of the e-commerce growth share.
Greater China Accounts for 42% of Global E-Commerce Growth
While growth rates typically highlight smaller markets with lower baselines, net growth reflects the contribution to total increases in absolute numbers. In this case, the leading e-commerce market is also the dominant contributor to total increases: Greater China. The country contributed an increase of US$175 billion in e-commerce revenues this year, making up 42% of total net growth.
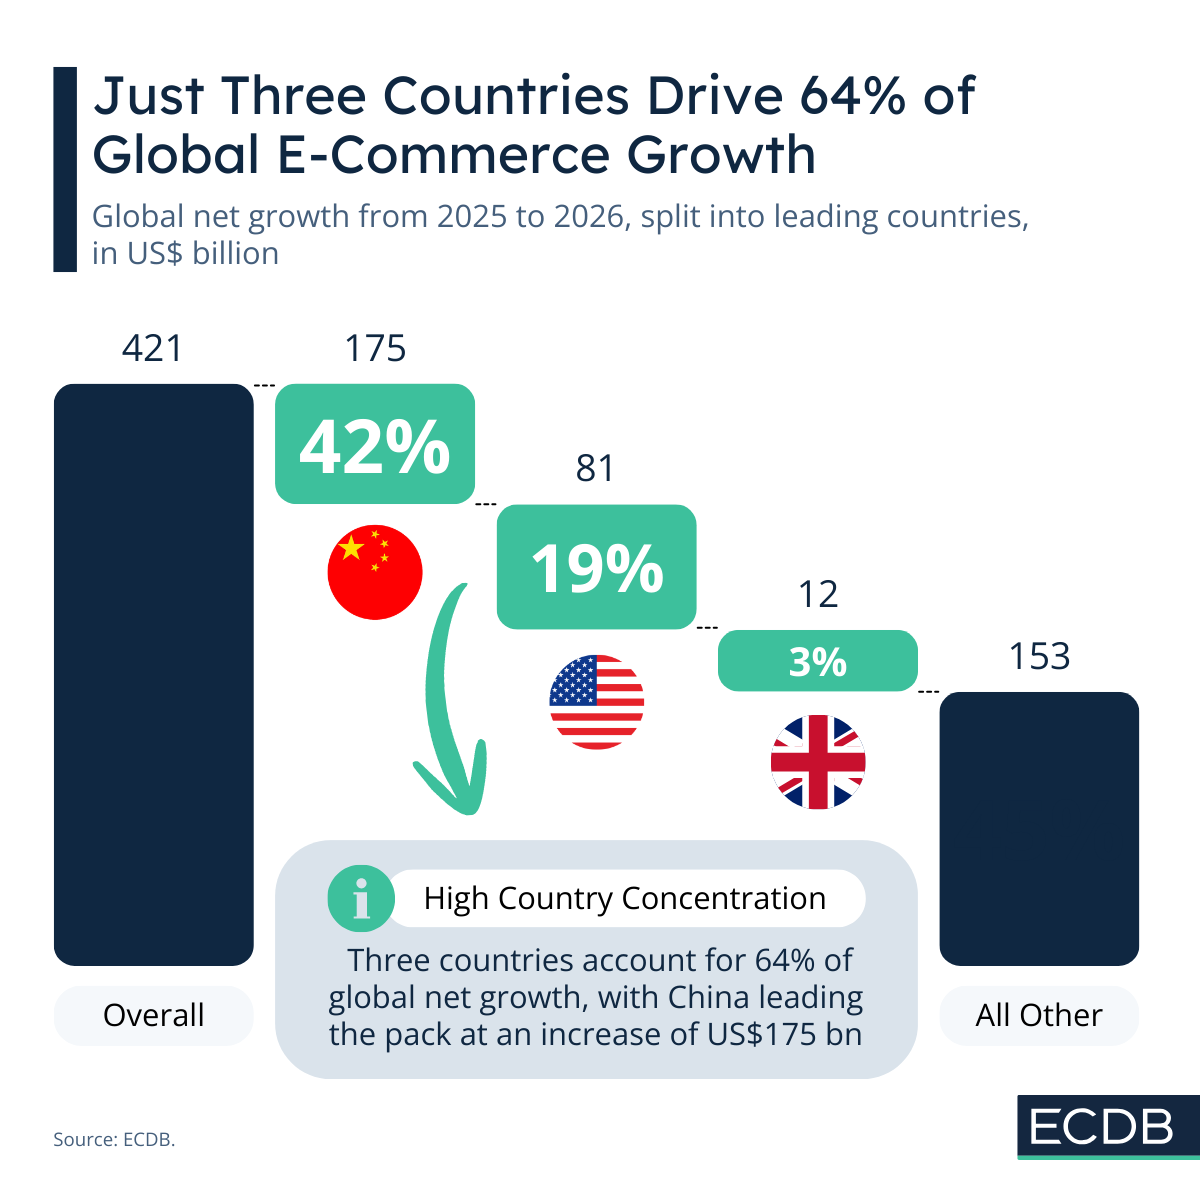
Further behind are the United States (US$81 billion and 19%), as well as the United Kingdom (US$12 billion an 3%). Together, the three leading e-commerce countries drive 64% of global growth, which reflects how concentrated the market is already and promises to become in the future.
Three Platforms Capture Nearly 40% of New E-Commerce Revenues
From the perspective of individual players, the picture shifts slightly. The largest platforms remain the biggest contributors to total growth, but unlike at the country level, the top three do not dominate the majority. Together, Pinduoduo, TikTok (Douyin), and Amazon account for 39% of global e-commerce growth. This distribution shows a more dispersed concentration and leaves room for other players to contribute.
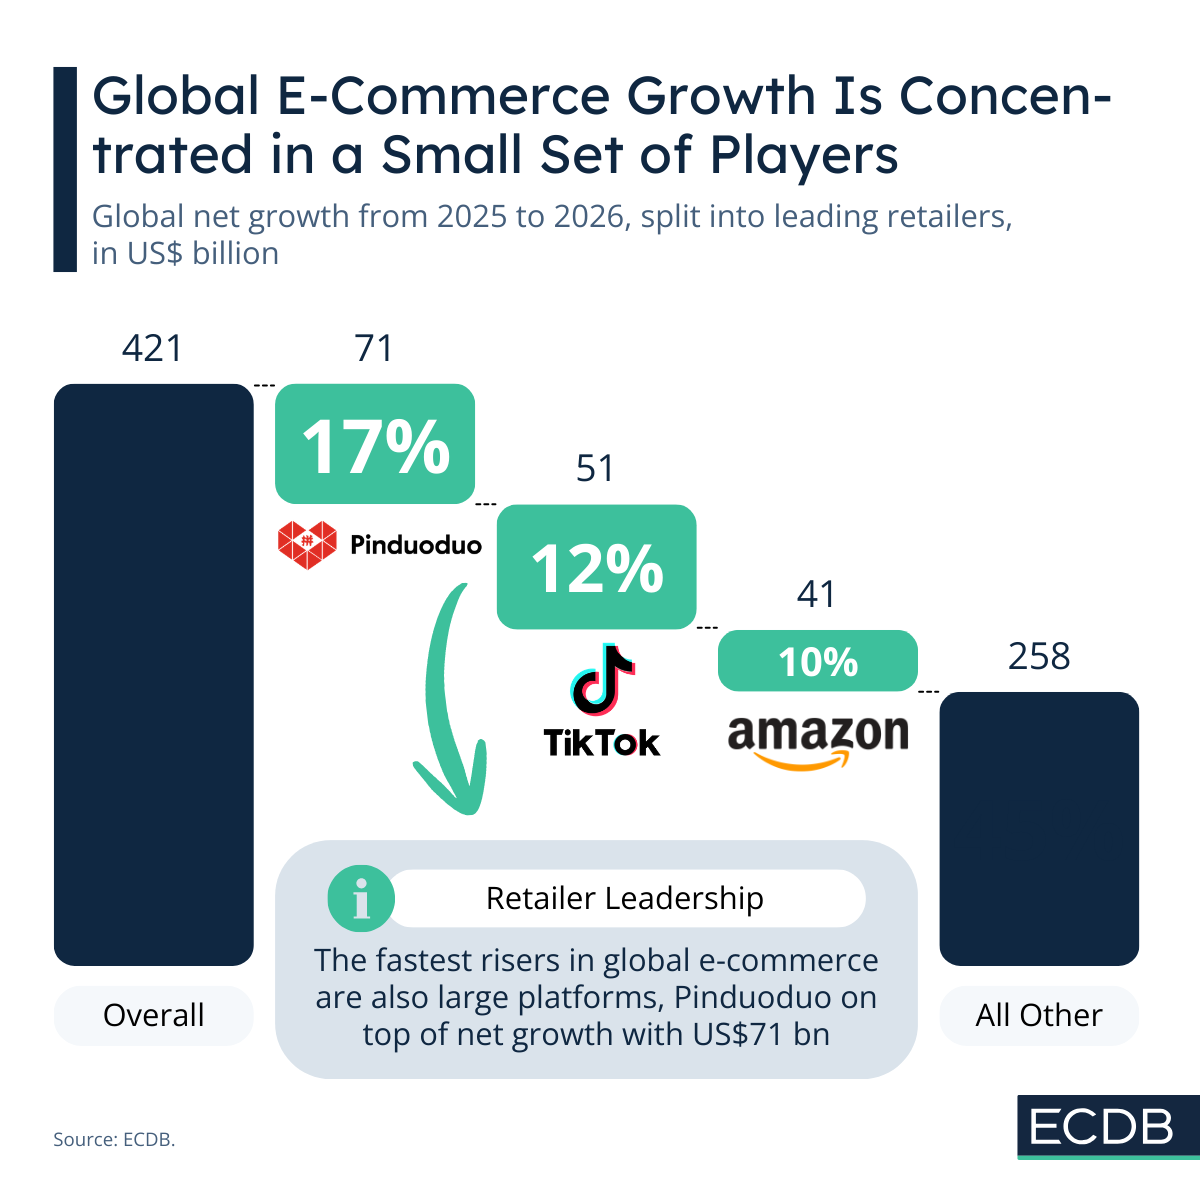
Pinduoduo, sister company to Temu, is the highest growing player with a net growth of US$71 billion and a share of 17%. TikTok (Douyin) follows with US$51 billion and 12%. Ultimately, Amazon represents US growth with a net growth value of US$41 billion and 10%.
Highly Concentrated: China and US Ahead
As a result of all of the above, dominance continues in absolute revenue numbers. What net growth showed us earlier is a dynamic picture, while the static version reinforces the image of two giants far ahead of the smaller rest. Foremost of them all Greater China, which has cracked the US$2 trillion threshold and is at a total revenue figure of US$2.2 trillion in 2026.
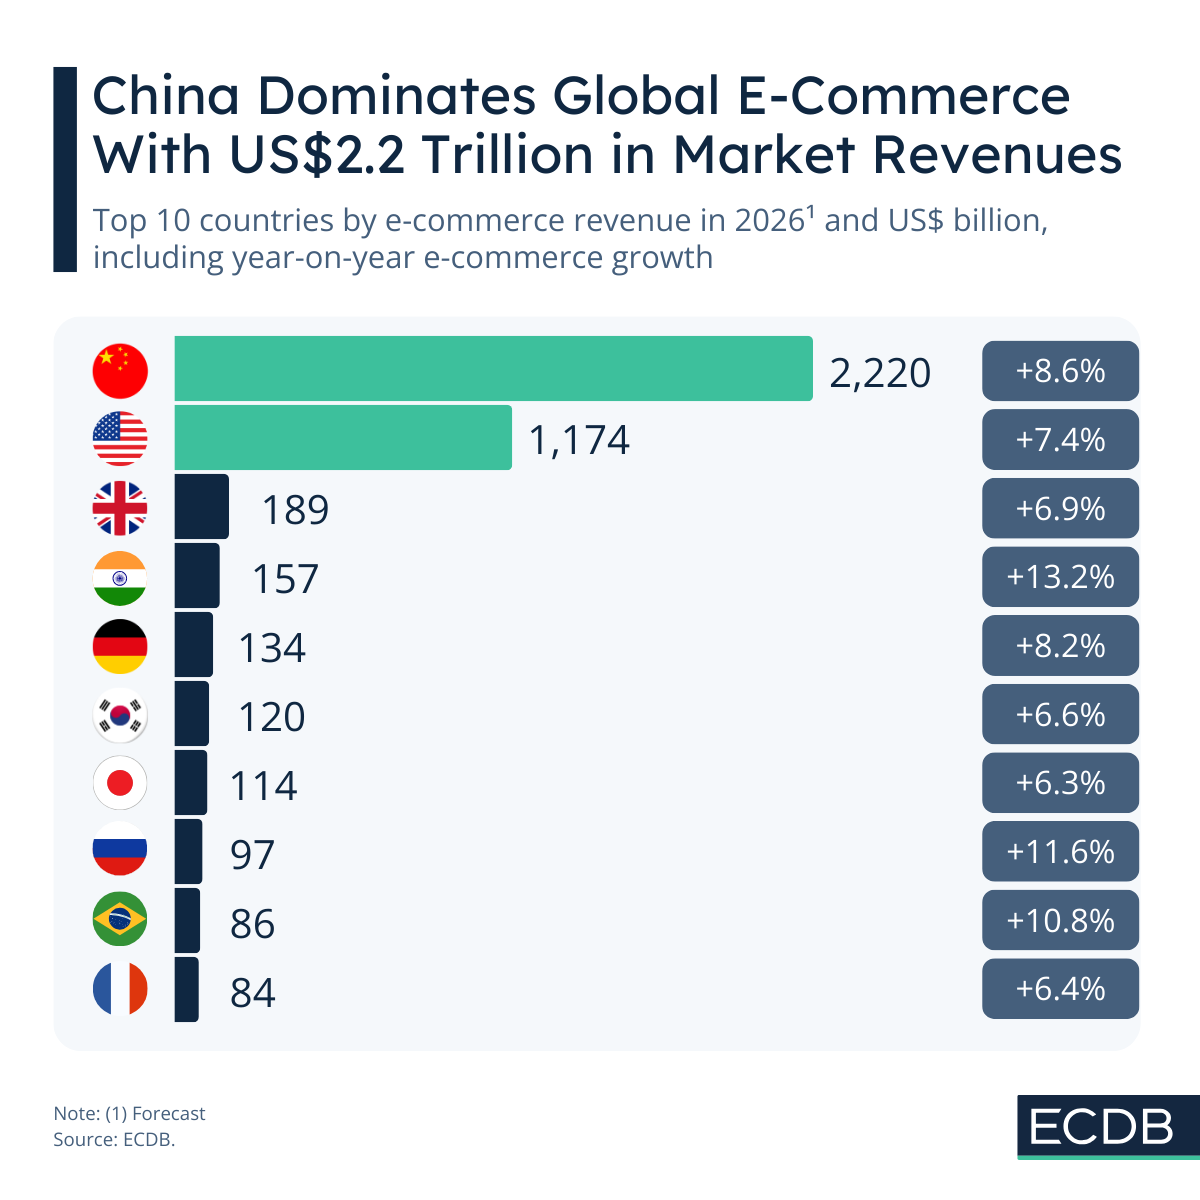
The United States is a little behind of that, with US$1.7 trillion. China is ahead of the United States in terms of growth as well, at 8.6% year-on-year increases, compared to 7.4%. Among the top 10 countries, India and Russia mark the fastest growing ones, at respective rates of 13.2% and 11.6%. The concentration is not only a hard fact of the e-commerce world, it is an ever continuing one as well.
Two Leading Markets Generate 64% of Market Revenues
As in growth, the status quo of total e-commerce revenue reinforces the current market concentration: 64% of e-commerce revenues in the world are held by China and the United States.
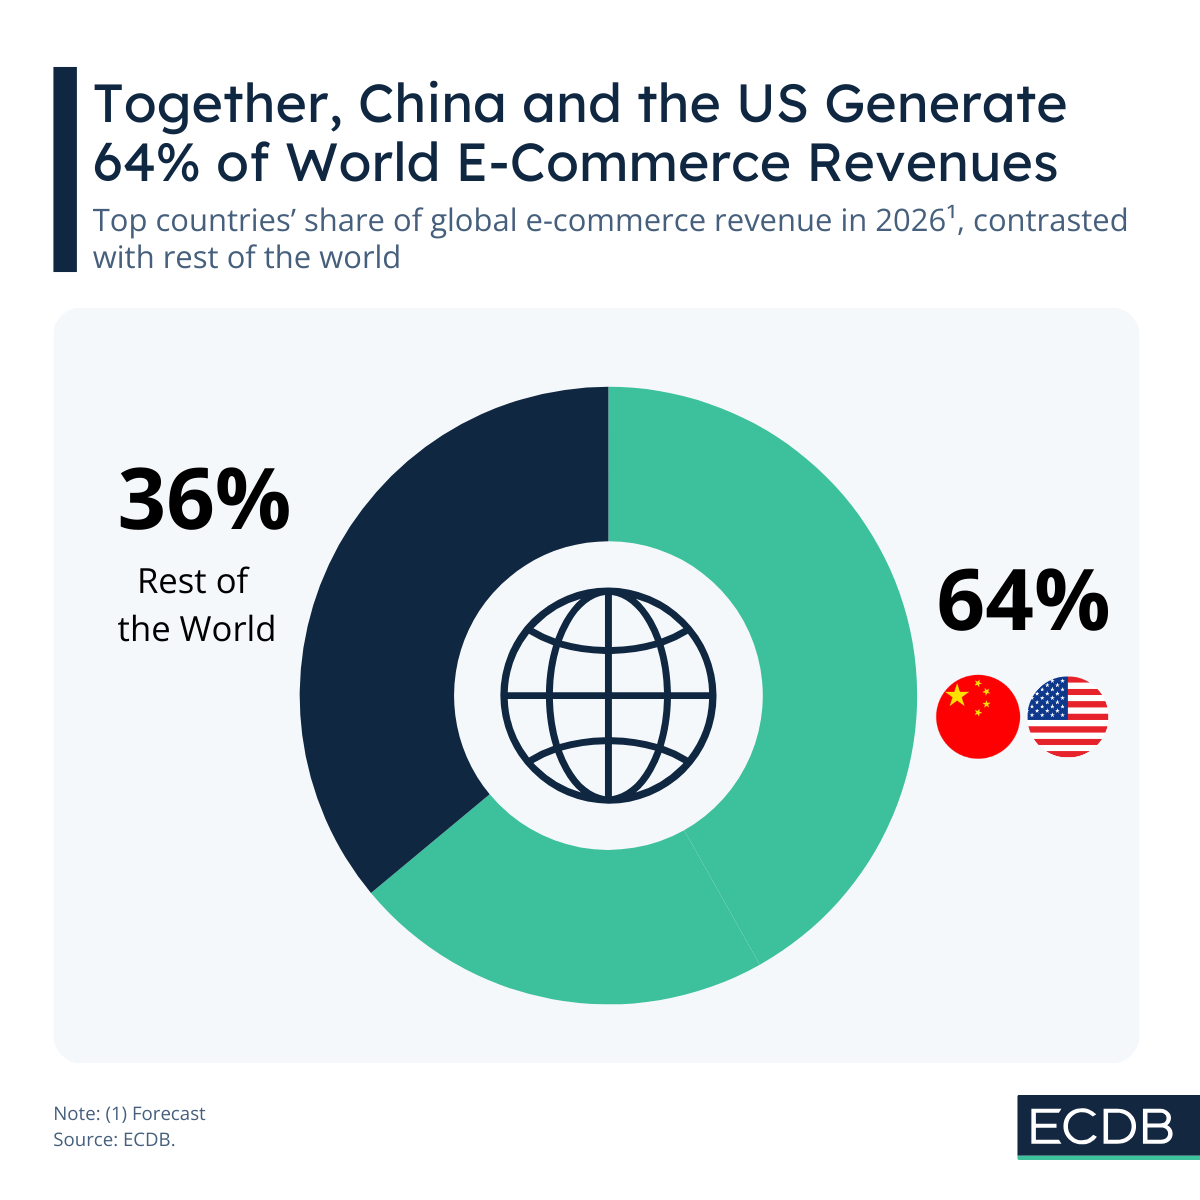
In total, the rest of the world unites 36% of e-commerce revenues. This fact has an important implication on current political developments, because tariffs and trade barriers reinforce the present concentration by making cross-border competition more costly for smaller or emerging markets.
Market Concentration 2026 and More
The global e-commerce market is highly concentrated, and that concentration continues to reinforce itself. Greater China and the United States together hold 64% of total revenues, and when combined with the United Kingdom, they account for the same share of growth. Platform-level concentration is slightly lower, with the top three platforms driving nearly 40% of new growth.