Where Does Cross-Selling E-Commerce Convert Best and Why?
Cross-selling is one of those e-commerce strategies used to improve e-commerce sales. But for whom does it make sense? Which other strategies are aligned with it?
Average Order Value
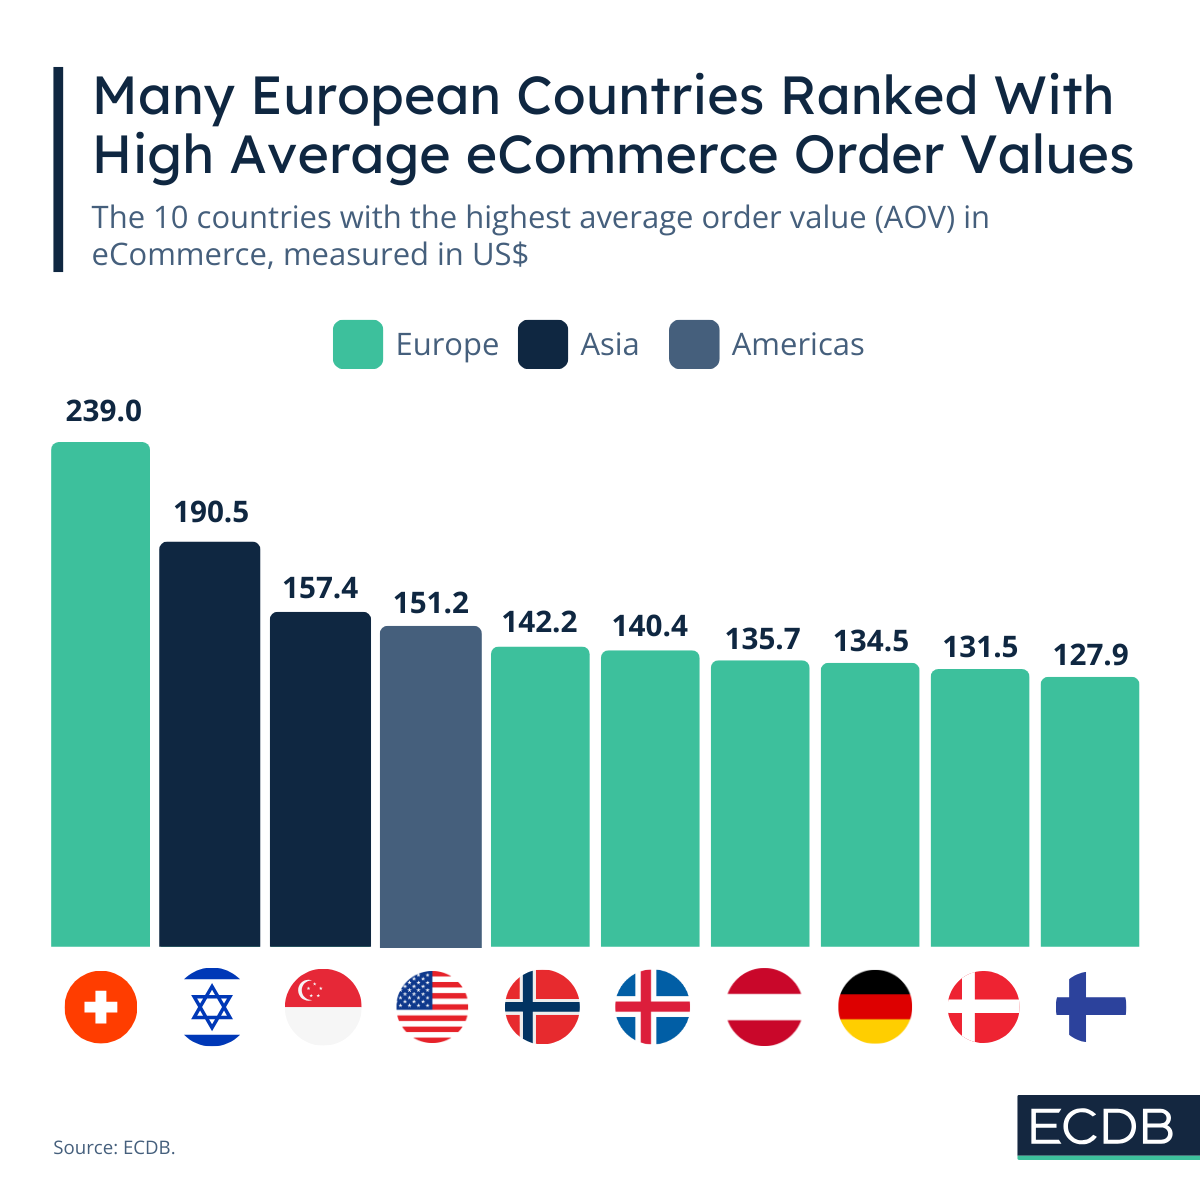
Where is the highest average order value (AOV) in eCommerce by country? The results show a clear trend.

Nadine Koutsou-Wehling
Data Journalist
February 19, 2025
Transactions
Average order value (AOV) is used as a measure of how well a company is selling and marketing its products to consumers. As with most things in life, striking a balance to find the ideal AOV is a desirable goal. Essentially, the aim is an AOV that reflects both competitive pricing and sufficient compensation for the products being offered.
The size of AOV particularly depends on the product category: Valuables like jewelry and precious metals will naturally be orders of higher value than groceries or care products. But AOV also varies from country to country. In general, a high AOV reflects high income levels, good digital infrastructure and a combined willingness to spend a good amount on online orders.
Assessing appropriate AOV levels must consider a country perspective. Each country has different income levels and online shopping habits, so some will have a higher AOV than others.
At ECDB, the AOV is calculated in dividing revenue by orders. More precisely, this means subtracting discounts and returns from total revenue. The equation is as follows:
(Revenue – Discounts – Returns) / Number of Orders = Net AOV
The global AOV across all categories is US$116.1. The leading market in terms of AOV size is Switzerland, where consumers spent on average US$239.0 on an eCommerce order in 2024, more than double the global average. This is by far the highest value of any country. It reflects the argument just given: Switzerland is a small, but affluent market with a high level of digital integration.
Israel and Singapore follow in the top 3. Consumers in Israel spent US$190.5 on an average order in 2024 and Singaporean consumers were at US$157.4. Singapore is the only Southeast Asian country in the top 10, with most of the other positions held by European countries.
Ranks four to ten are dominated by European countries, with the exception of the United States at number four. U.S. consumers spent an average of US$151.2 per eCommerce order. Norway follows in fifth place with US$142.2 and Iceland in sixth place with US$140.4.
Other affluent countries in Western and Northern Europe make up the remaining positions, namely: Germany in 8th with US$134.5 per order, Denmark 9th with US$131.5 and Finland 10th with US$127.9.
Keeping these standard AOVs in mind is important because in some countries it is not usual for consumers to regularly spend a great deal on their purchases. Average income levels play a role, as do online penetration and the size of the eCommerce market.
Within these country considerations are also the product categories that play an important role in AOV. For instance, an average order for care products tends to be lower-priced than for furniture or electronics, where items are usually more expensive and therefore result in a higher AOV.
For exactly this reason, ECDB presents transaction KPIs across countries and product categories, so that businesses can benchmark their performance in the exact industry in which they operate.

Related Articles
Cross-selling is one of those e-commerce strategies used to improve e-commerce sales. But for whom does it make sense? Which other strategies are aligned with it?
Launching new products too often relies on hunches and guesswork than traceable market data. ECDB provides the answer based on real-time e-commerce market intelligence.
New data shows that for specialist marketplaces, adding adjacent categories is the more sustainable path to revenue growth than acquiring new buyers. Two case studies, Zalando and Trendyol, show how it's done.
Click here for
more relevant insights from
our partner Mastercard.
Book a demo to see how ECDB's market intelligence can support your business.