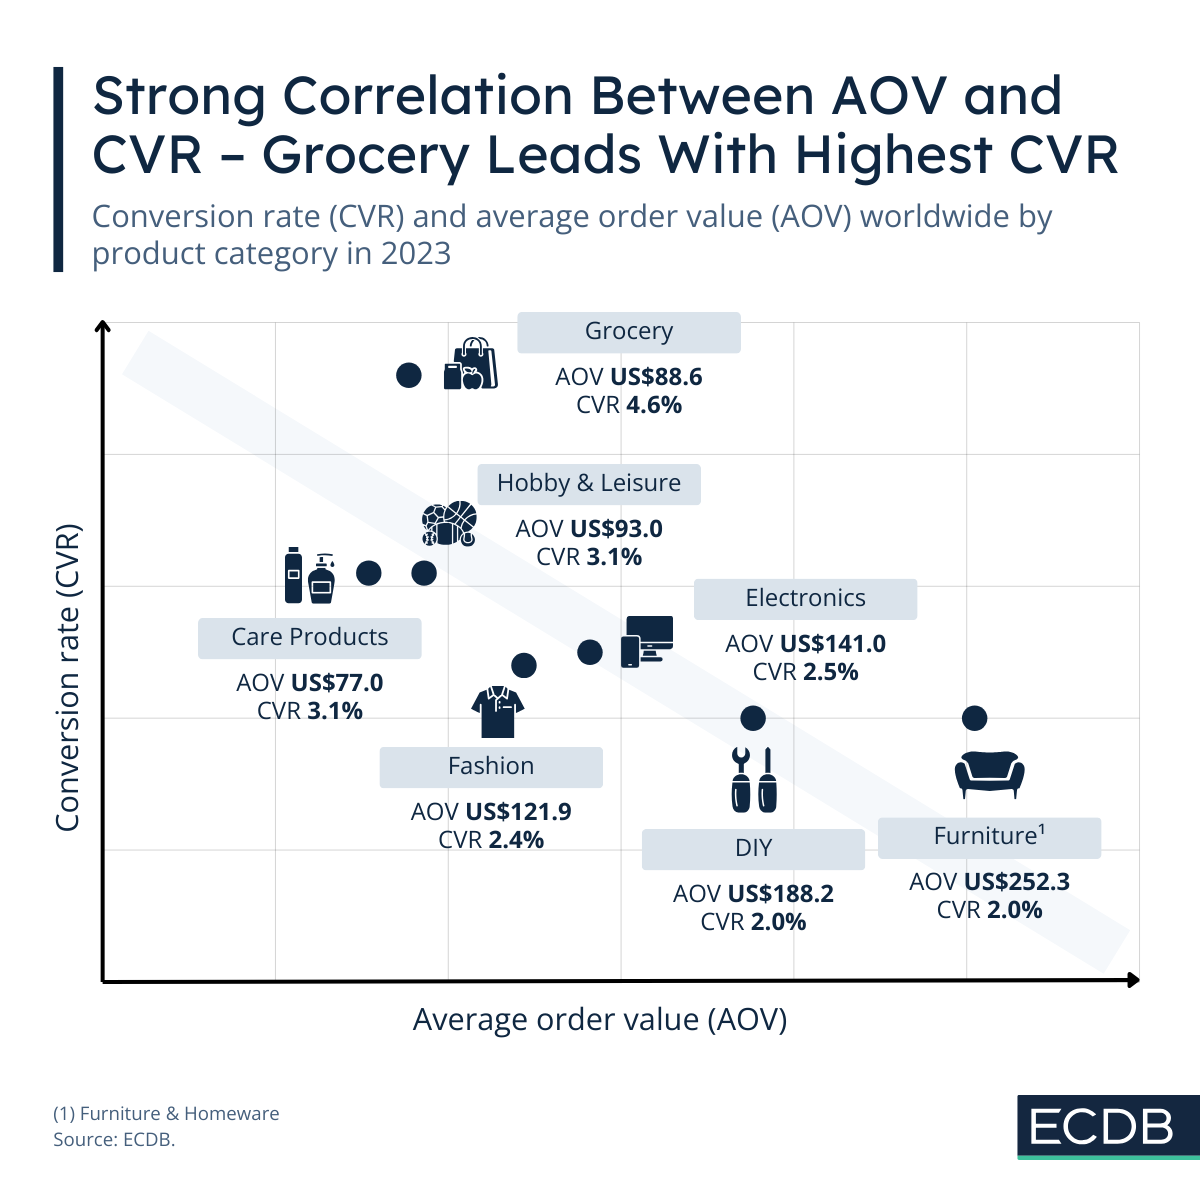
Benchmarks on ECDB provide a view of consumer behavior based on their shopping journey. In this case, we have plotted CVR (conversion rate) and AOV (average order value) within ECDB’s 7 main product categories. Across all categories, the average value for both KPIs is a CVR of 2.4% and an AOV of US$114.5. This means that 2.4 out of a 100 people buy products from a website they visit, while they spend on average US$114.5 per order.
The most salient finding of the analysis is that there is a negative correlation between the two KPIs: A higher conversion rate typically corresponds to a lower average order value. Accordingly, a lower CVR is associated with a higher AOV.
It leads to a significant finding about consumer behavior: The higher the price, the lower the percentage of people buying a product during their visit. Possible explanations may include that consumers take more time for their purchase decisions because of more intensive research about a product, thinking about a purchase by browsing multiple options, or checking prices while saving up for a choice.
For Which Categories Do AOV and CVR Diverge Starkly?
The product category with the highest AOV at ECDB is Furniture & Homeware, where the average order value is US$252.3. Its CVR is the lowest with 2%. Given that the price of a piece of furniture like a sofa, table, or wardrobe tends to be higher, the percentage of consumers making a purchase is lower.
But the reverse is also true: Low order values correspond to higher shares of consumers making a purchase during their visit. This usually has to do with the nature of the product, too. Case in point is grocery.
Grocery is the category with the highest CVR of all product categories, at 4.6%. Its AOV of US$88.6 is low, but not the lowest. The nature of this product category stands in direct contrast to the previous one, Furniture & Homeware, as Grocery includes perishables that are bought more frequently. For a habitual purchase category like Grocery, consumers tend to visit the site with a more immediate purchase intent.
Fashion AOV Is in Line With the Global Average
Fashion is the largest category in global eCommerce. Its conversion rate is 2.4%, the average for all categories. This is even though Fashion's AOV of US$121.9 is higher than the average (US$114.5). Fashion products are basically in the middle: It is one of those categories that consumers like to browse without a strong purchase intent, but it is typically not one that consumers tend to compare endlessly before deciding to buy.
CVR and AOV: Two Important Benchmark KPIs
Benchmark KPIs are integral to a business’s internal performance assessment. Benchmark analysis puts company data into perspective in terms of industry standards. How is the performance rated in direct comparison to one’s own market niche? This is where benchmark KPI’s come in. At ECDB, this topic is well known.
Therefore, ECDB offers access to a variety of transactional and conversion funnel KPIs that track the path users take, which begins with initial engagement (add-to-cart), potential points of improvement in the user experience (cart abandonment), and the successful conversion of interest into finalized sales (conversion rate).