Article in a Nutshell:
Global e-commerce growth: Revenues reached US$4.89 trillion in 2025 and are projected to surpass US$5 trillion by 2026.
Key growth drivers: Growth is fueled primarily by more online shoppers and a higher purchase frequency.
Category differences in buying frequency: Grocery is the most frequently purchased category, Furniture & Homeware the least.
Category differences in number of buyers: Electronics leads with 1.65 billion shoppers, while niche categories like DIY attract fewer buyers.
Global e-commerce revenues reached US$4.89 trillion in 2025 and are projected to surpass US$5 trillion by 2026. What's fueling this growth?
Since 2023, two key drivers have emerged as the main engines of expansion: purchase frequency and the number of online shoppers.
ECDB Revenue Equation: Two Factors Drive Growth in 2025
The total market value of e-commerce is at US$4.89 trillion in 2025. The ECDB Revenue Equation illustrates the components of its development. They include the average order value, returns, buying frequency and the number of buyers.
Shoppers spend on average US$146.8 on each e-commerce order. Of that value, 89.7% remain after returns. The true drivers of growth in recent years can be found in the remaining variables of this equation:
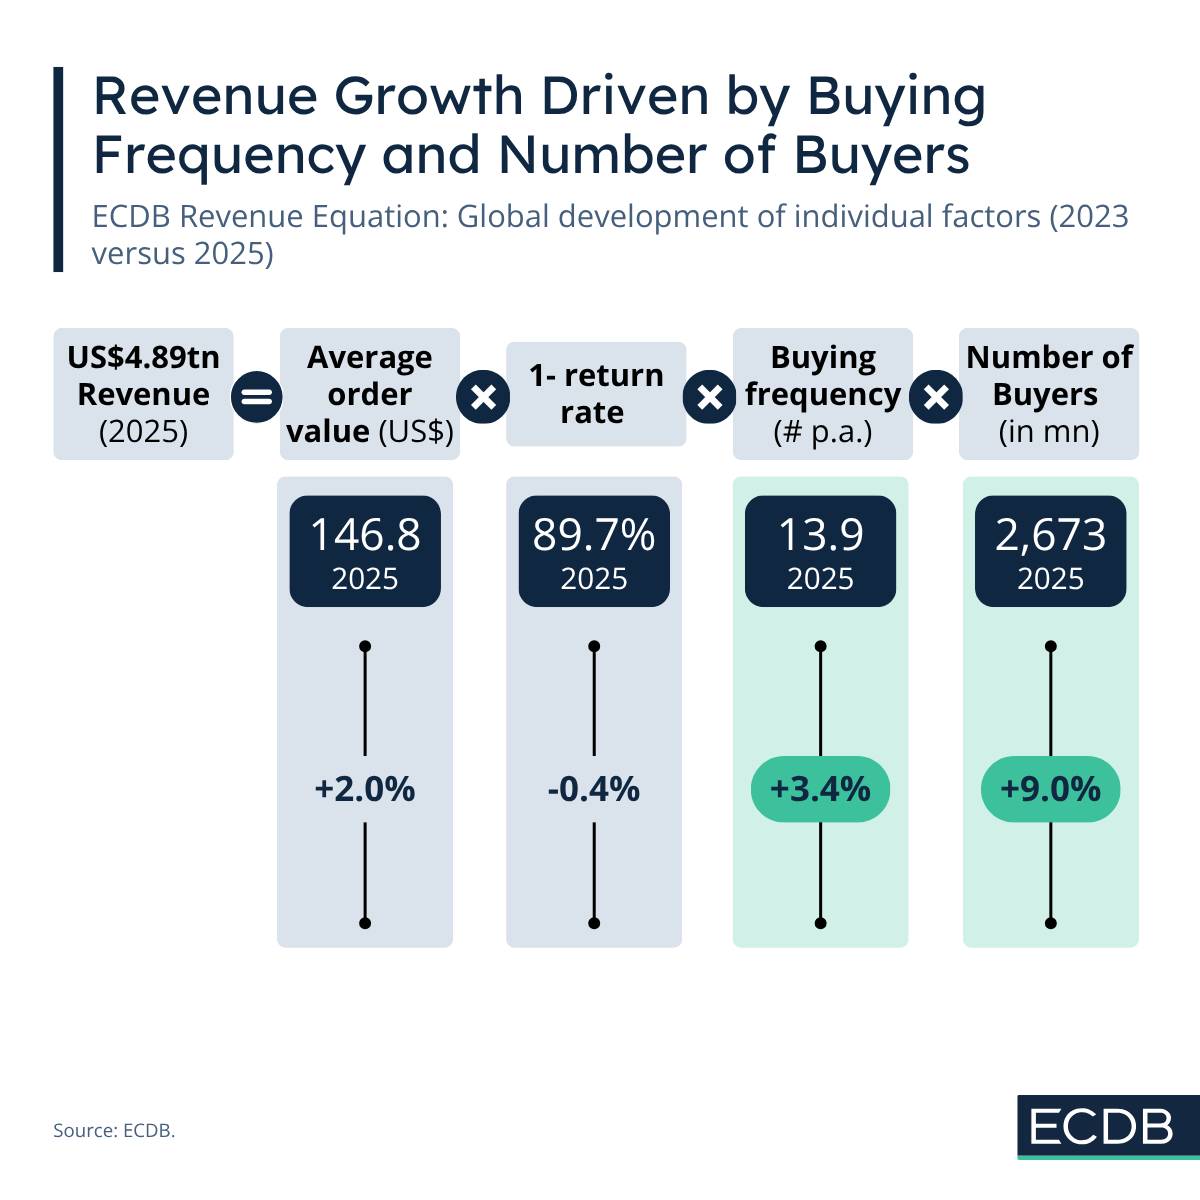
Purchase frequency means how often consumers shop online in a year. In 2025, consumers bought 13.9 times online, which marks an increase of 3.4% since 2023.
The number of buyers is measured in millions and was at 2.67 billion in 2025. Since 2023, it has increased by 9.0%. Number of buyers is therefore the number one growth driver of e-commerce revenues right now.
Values Differ Widely Across Categories
Across e-commerce categories, both buying frequency and the number of buyers vary widely.
Take buying frequency, for instance. Consumers buy different categories over the course of a year, the most frequent of which tends to be Grocery. In 2025, online shoppers bought Grocery 7.0 times on average. This high frequency reflects the perishable nature of food, household staples, and recurring needs that drive repeat purchases.
On the bottom end of the spectrum is Furniture & Homeware, which is not such a high-frequency category. It is bought around 2.5 times in a year. These items are typically higher-value, less frequently needed, and often involve longer decision-making processes.
The remaining categories are somewhat in the middle of the two, with the average category being bought around 4.6 times in a year.
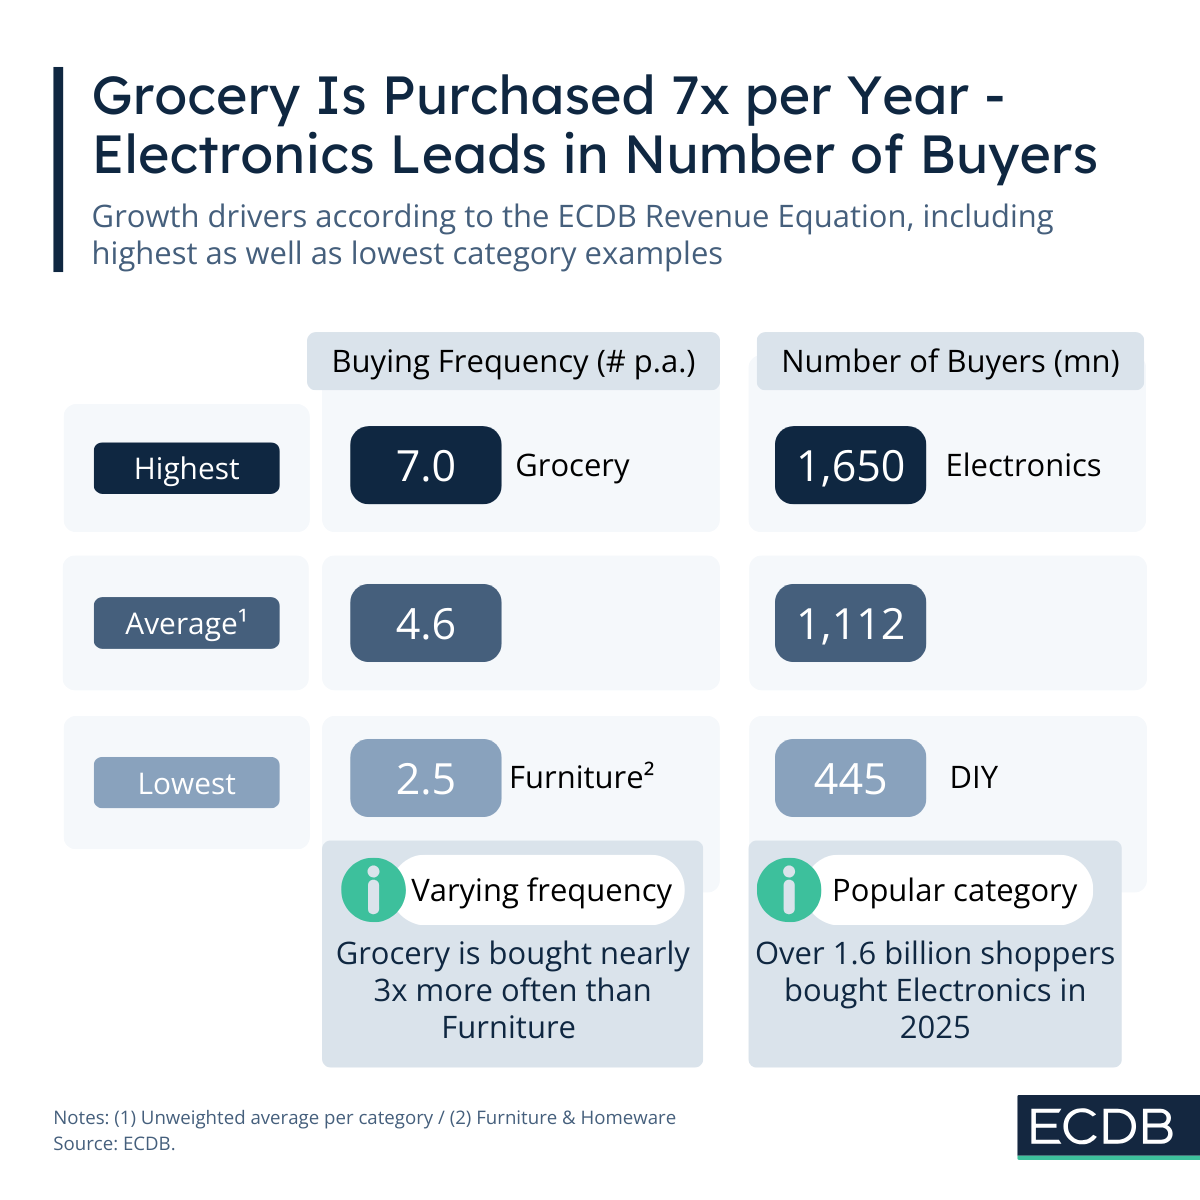
When we look at the number of buyers, the pattern is similarly uneven. Electronics is the most widely purchased category online, attracting 1.65 billion shoppers in 2025, driven by consumer demand for gadgets, devices, and accessories.
On the opposite end, categories like DIY (Do-It-Yourself) draw a smaller, more niche audience, with 445 million buyers. They reflect specialized interests and thus a more selective number of consumers buying DIY online.
The ECDB Revenue Equation: Takeaways
E-Commerce growth comes from more people buying online and buying more often. With both the shopper base and purchase frequency rising, the global e-commerce market is set for continued expansion well beyond the US$5 trillion mark in 2026.