June 2026 E-Commerce Recap: US$436.8 Billion in Global Revenue
The start of summer brought positive developments in June, with US$436.8 billion in global e-commerce revenues and a 9.5% year-on-year increase. Read on for the details here.
Luxury Products in eCommerce
The brand experience is at the forefront of consumer spending on luxury products.

Nadine Koutsou-Wehling
Data Journalist
January 27, 2025
Market Trends
Right now, Fashion Week starts in Paris, Copenhagen, and Berlin. This provides an opportunity to look at luxury eCommerce and how it differs from the overall market. During the pandemic, luxury products seemed to find a channel in eCommerce that offset some of the losses this exceptional situation caused. But in the years since, it has become obvious that offline channels remain the preferred way for luxury customers to buy their products.
In general, luxury online shares follow the development of the overall market: There was a peak in online sales at the height of the pandemic, followed by a decline in online shares in the years after. This is because luxury customers, like everyone else, returned to physical stores in 2022. But for luxury product categories, eCommerce often isn’t the primary focus.
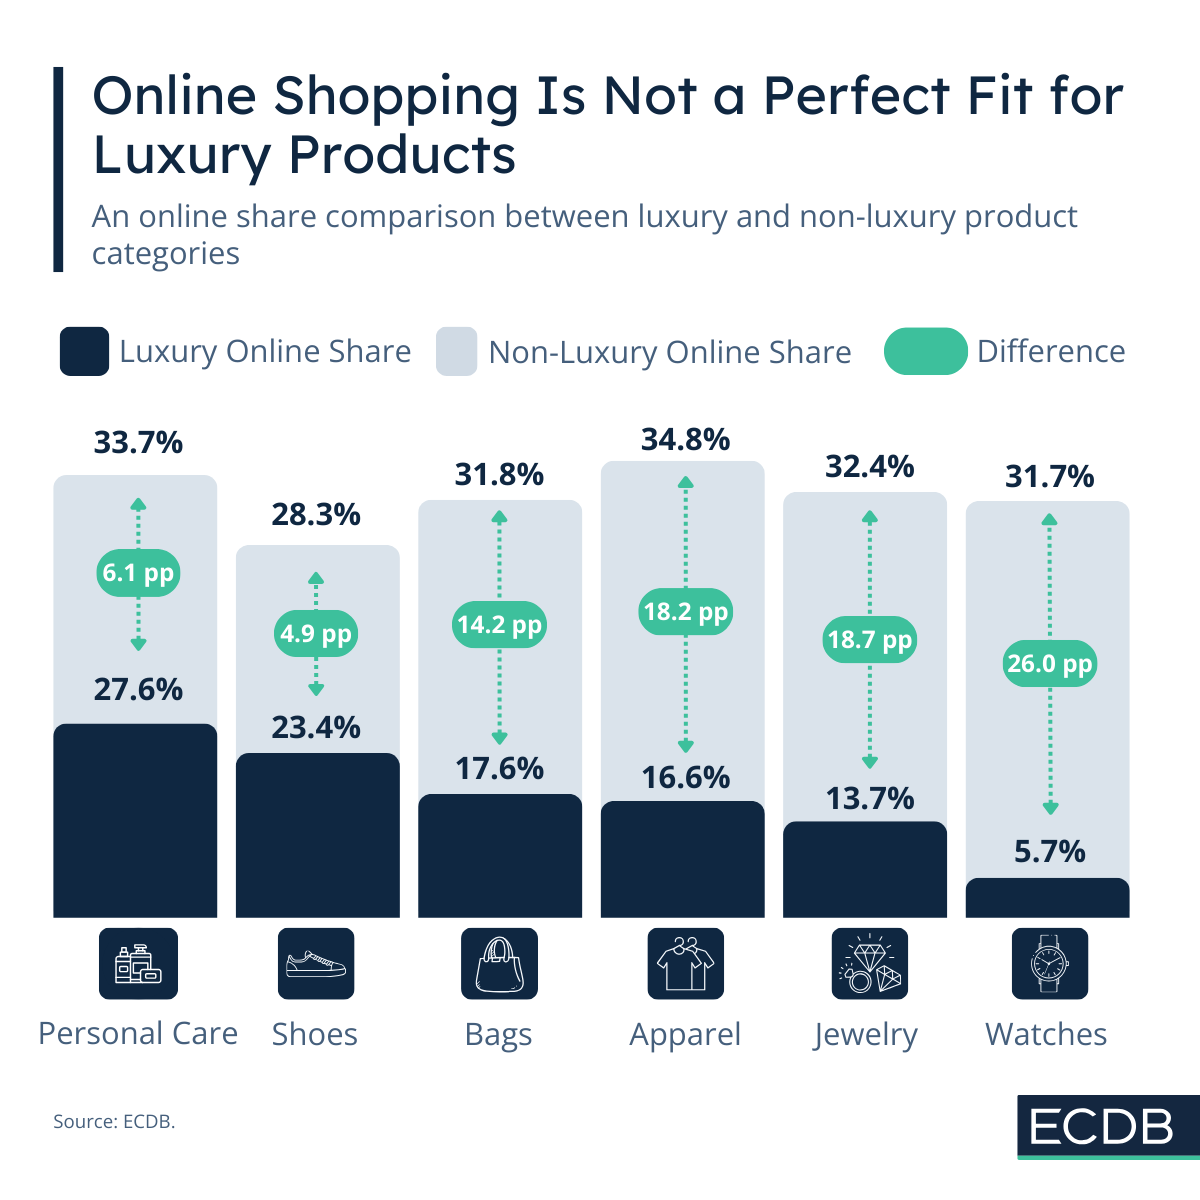
Looking at the online shares of the total market, luxury product categories have consistently had lower online shares. When comparing the online shares of product categories in 2024, divided into luxury and non-luxury, the difference starts at around 5 percentage points (Shoes) and reaches up to 26 percentage points (Watches).
The exclusive nature of luxury products, combined with the special relationship between brands and their customers, often makes offline channels more favorable than online sales.
In most cases, it isn’t just about the product itself – the experience of buying it is equally as important. Customers who spend thousands of dollars on a purchase want to receive the face-to-face acknowledgement of a store representative, which is more impactfully given in a physical location than on a website.
The extent of this tendency varies across product categories and becomes more pronounced with higher-value items. For example, in the Watches category, luxury Watches had an online market share of just 5.7% in 2024, compared to 31.7% for Watches in the overall market — the largest gap observed across all categories. Given that luxury Watches serve more as status symbols than mere timekeeping devices, the significance of in-person interactions during the purchase becomes even more apparent.
There is also the element of trust to consider. As prices rise, the risk of encountering fakes or counterfeits increases significantly. This risk is exacerbated in online channels, where it is more difficult to verify product authenticity.
Conversely, the luxury product category with the highest online share is Personal Care with 27.6%. This includes products like fragrances, creams, and makeup. Considering that these are the luxury products which tend to be most accessible to the general public, buying them online does not mean foregoing the special treatment in-store. In addition, the shorter lifespan of Personal Care products leads to more frequent use, making them an ideal category for online reorders.
Quite simply, it is highly unlikely that some luxury product categories will ever reach the same level of online share as their non-luxury counterparts. As in the case of fashion weeks, despite the availability of online alternatives, some experiences are bound to happen physically. With a growing integration of the online market, hybrid experiences are likely to become more relevant, but the benefits of offline channels remain.
Related Articles
The start of summer brought positive developments in June, with US$436.8 billion in global e-commerce revenues and a 9.5% year-on-year increase. Read on for the details here.
Central Europe is dominated by one market in particular: Germany. The others follow at a far distance. They include Poland, Austria, Switzerland, and Greece. Here is how they compare.
In Italy, 66% of the top 250 online store's net sales are generated by the top 5. This makes it the most concentrated market among the EU-Big Five. What does that mean for e-commerce? Find it out here.
Click here for
more relevant insights from
our partner Mastercard.
Book a demo to see how ECDB's market intelligence can support your business.