Personal Care is one of the product categories that are soaring at the moment – driven by live commerce and social integrations as well as a global shift toward self-maintenance and self-improvement.
In a revenue analysis, not only the development itself is of interest. It is further important to know how the outcome emerged – was it a change in the number of buyers, or in their behavior?
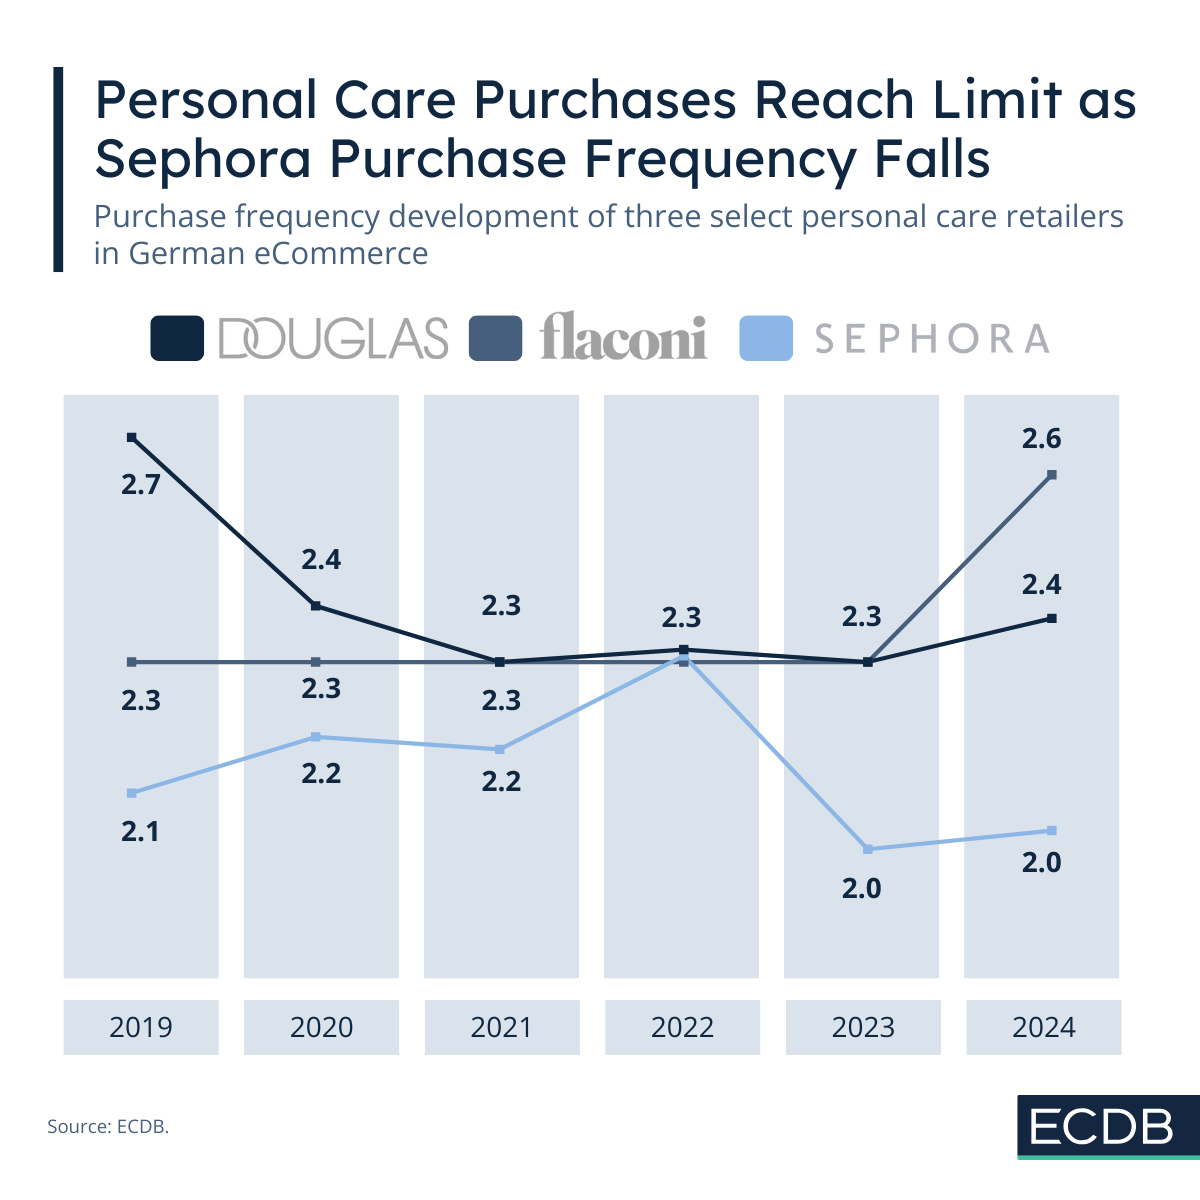
At ECDB, it is now possible to track the purchase frequency development of consumers at select retailers. In this example, we used douglas.de, flaconi.de and sephora.de to draw conclusions on personal care eCommerce in Germany.
Sephora.de’s Surge Was Due to an Increase in Buyers, While Purchase Frequency Was Capped
Sephora is one of the winners of global eCommerce over the past five years. Since, 2020, Sephora’s entire eCommerce revenues have more than doubled (117%). The German domain sephora.de does not even belong to the top 5 domains, but still ranks within the top 20 of German Personal Care eCommerce.
The case of sephora.de quite clearly illustrates how revenue explosion isn’t necessarily predicated on the number of times consumers buy at a store. In this case, the global hype led to a subsequent increase in users, with which sephora.de increased revenues from US$19 million in 2019 to US$90 million by 2024.
Purchase frequency, on the other hand, first fluctuated and then decreased. It started out with an average of 2.1 times in 2019 to 2.3 times in 2022, ending up with 2.0 times in 2023 and 2024.
Sephora.de's status as a hyped personal care retailer on social media may explain why its average purchase frequency is capped. Given the social commerce trends and a flood of younger consumers joining the mix, spend tends to remain rather low. Sephora.de’s last net AOV was at US$96.1 in 2024.
Comparing this to US$99.0 for douglas.de and US$96.8 for flaconi.de shows that sephora.de is not even the domain where consumers spend most per annual purchase.
Flaconi.de and Douglas.de Halt at a Similar Performance From Different Pathways
At a similar purchase frequency in 2024 are flaconi.de and douglas.de. Douglas fell from its 2019 figure, to pass through a valley of 2.3 times a year between 2021 and 2023, only to reach 2.4 times again in 2024.
In contrast, Flaconi was at a stable 2.3 times a year from 2019 to 2023, surging in 2024 to reach a level of 2.6 times a year in 2024. Both douglas.de and flaconi.de saw revenue increases over the observed time span, each experiencing revenue growth of around 100%.
The increase occurs because of a general hype of personal care eCommerce, which is driven by factors such as media hype, good marketability, a growing consumer base and developing trends towards self-maintenance and maximizing one’s outer appearance. This goes for both male and female consumers.
There Is a Cap on Personal Care Purchase Frequency
However, there is a cap on personal care eCommerce. In essence, there are only so many times a year the average consumer perceives the need to buy Personal Care products. Be it makeup, facial creams or sunscreen, using up a product takes time and everyday essentials are largely bought at brick-and-mortar stores.
This is where Sephora and Douglas add on to the online channel with a physical store network that Flaconi lacks. The ensuing cost saving aspect may result in decreasing awareness of the retailer, leading consumers to turn elsewhere for their personal care purchases.