Key Markets Choose Fashion as Number One Product Category, Electronics Behind
The patterns in what product categories are most favored leave important insights on eCommerce markets across the globe.

The top product categories in eCommerce reflect broader preferences prevalent in online markets. In online shopping, the market environment counts; it is made up of several factors, including national industry, economic variables and consumer mentality.
Product category rankings highlight the universality of eCommerce patterns as well as the unique characteristics of each market. For six select countries, ECDB is going to examine the distribution of top product categories.
Fashion Leads Most Product Category Rankings
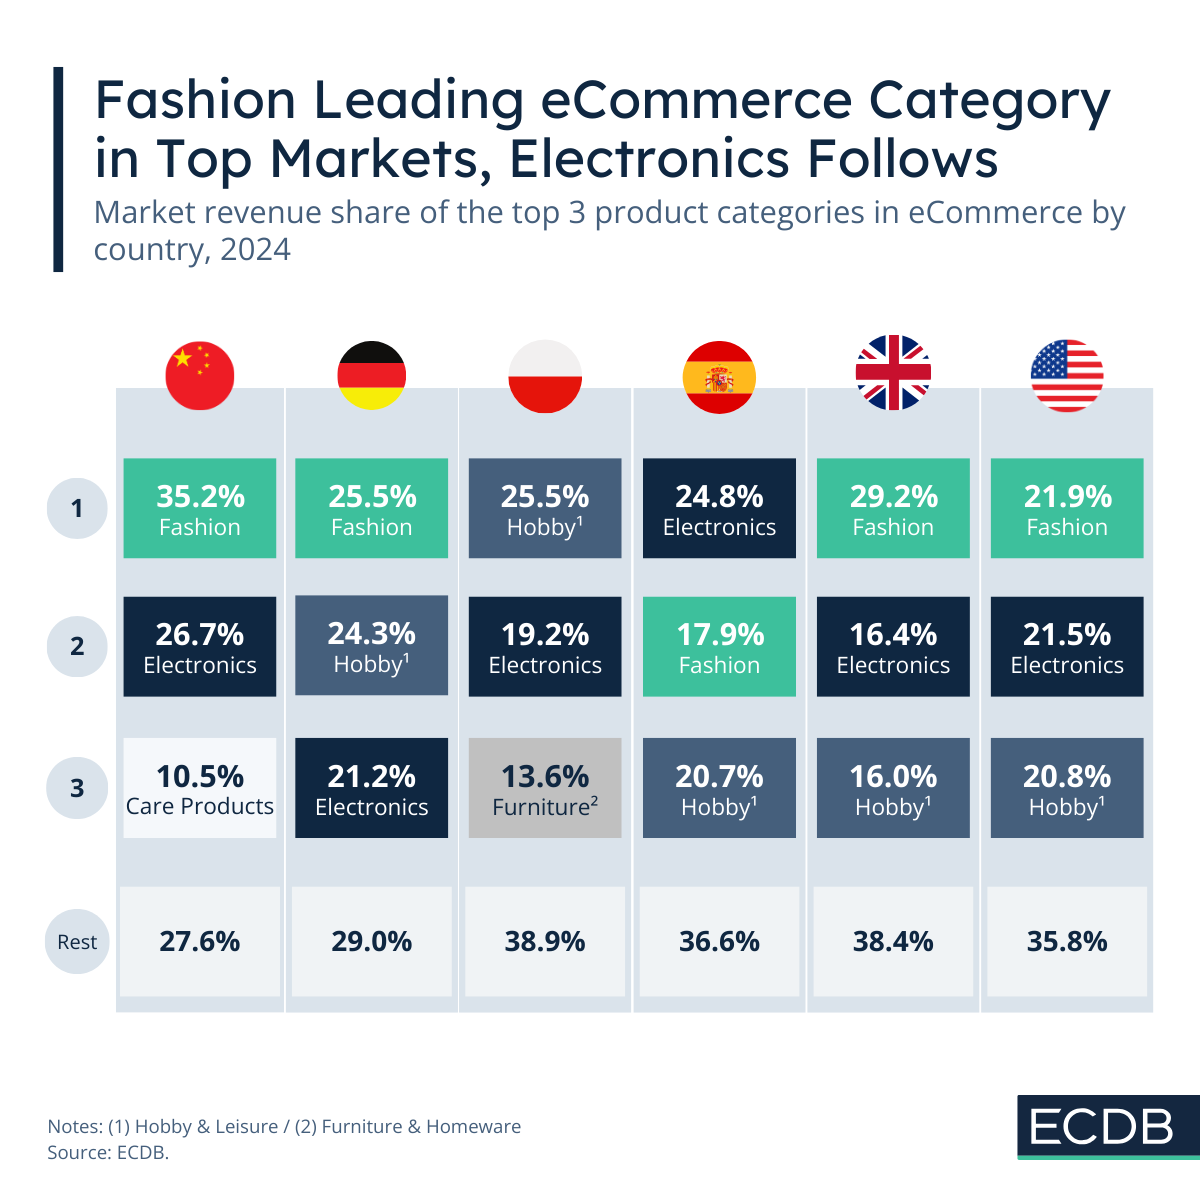
In most of the countries depicted, Fashion accounts for the largest share of eCommerce market revenues. This is also true for the global average, where Fashion accounts for 27.4% of eCommerce revenues.
Among the six markets depicted, Fashion ranks first in four of them. It is most significant in China, where Fashion revenues make up more than a third (35.2%) of the online market. Fashion is also important in the United Kingdom, with a market share of 29.2%, which is above the world average.
Fashion lends itself well to eCommerce due to its easy distribution, straightforward marketing and prevalence across online channels. But the appeal of Fashion eCommerce is not the same in all markets. In Spain, Fashion ranks second with 17.9% of market revenues behind Electronics. Poland is an exception among the six, as Fashion does not rank in the top three categories.
Electronics Rank First in Spain and Second Elsewhere
In most markets, Electronics eCommerce follows Fashion as second highest revenue generator. In Spain, Electronics ranks first with 24.8% of market revenues. In China, Poland, the UK and the U.S., Electronics ranks second. Globally, Electronics accounts for 24.0% of market revenues.
China’s Electronics share exceeds the world average, as Electronics eCommerce makes up 26.7% of Chinese market revenues. In other markets, however, its contribution is below that. The fact that Electronics tend to be higher-priced items facilitates high revenues, but it also means that consumers tend to be more cautious before making purchases in that category.
In Germany, Electronics ranks as the third-largest eCommerce category, accounting for 21.2% of revenue. This comes despite Germany’s reputation for preferring Electronics. While Electronics ranks second in the UK, its revenue share is much lower, at 16.4%. In the United States, Electronics ranks as a close second to Fashion, with a revenue share difference of only 0.4 percentage points.
Hobby & Leisure: An All-Round Popular Category
Third in world averages is Hobby & Leisure, which holds a similar position in the six markets selected for this analysis. This category encompasses various subcategories, all related to leisure activities: Bullion & Precious Metals, Camping & Adventure, Erotic & Adult, Flowers & Gifts, Media and more.
Due to the sheer variety of categories belonging to Hobby & Leisure, its prevalence across top 3 rankings in the six markets is high. Notably, Hobby & Leisure ranks as the number one category in Poland, accounting for a 25.5% market share.
Hobby & Leisure has a similar success in Germany, where it is the second most popular category, accounting for 24.3% of the market. In Spain, the UK and the U.S., Hobby & Leisure ranks third, with varying revenue shares.
In Poland, Hobby & Leisure is in first place, Electronics is second and followed by Furniture & Homeware, with a 13.6% market share. Allegro’s outstanding position in the Polish eCommerce market contributes to its particular product mix. In the coming years, a rise in market revenues and online share may lead to further shifts in Poland’s product mix.
Market Specifics Determine Product Mix
Apart from the broader commonalities, which include a preference for Fashion, Electronics, and Hobby & Leisure, specific market characteristics remain. On the one hand, this regards the positioning of the most prevalent product categories.
On the other hand, the occurrence of product categories can differ more significantly. This includes, for instance, Care Products on the third rank in China. A wide preference for this category, including Personal Care and Health Care, is supported by the easy access to these product types at affordable prices on leading Chinese eCommerce platforms.
Market Concentration Reflects Category Significance
Apart from the occurrence of product categories within the top 3 rankings, market concentration of the categories plays an additional role. In the example of the six select markets, the top 3 in China and Germany are highly concentrated, leaving a relatively low share of around 28.0% for the remaining categories in these markets. Other markets, such as Poland and the UK, leave a larger share for other categories outside of the top 3 and therefore indicate a more even distribution.
The contrast in market concentration indicates that in places like China and Germany, success may hinge on competing within a few dominant categories. In markets such as Poland and the UK, however, a broader spread of preferences could create openings for more diverse product strategies.
Related Articles
All ArticlesReady to Unlock the Full Power of ECDB?
Book a demo to see how ECDB's market intelligence can support your business.