Electronics Is the Biggest E-Commerce Category in the US. Meet the Top Retailers Behind It.
Electronics is not just consumer tech, as the top 100 retailers in the US market show. Here is who's behind the United States' largest category.
Third-Party E-Commerce Marketplaces
When it comes to third-party (3P) GMV, Amazon is being increasingly challenged by other marketplaces in the global top 10. The factors contributing to their rise can be found in the ECDB Revenue Equation.

Nadine Koutsou-Wehling
Data Journalist
March 23, 2026
Retailers
Article in a Nutshell
Amazon’s 3P share is slipping: From 16.1% of global top 100 marketplace GMV in 2023 to 14.4%, while top challengers are gaining market share.
Challengers are rapidly growing their buyer base: Amazon has 1.46B buyers, but top rivals are quickly closing the gap.
Shoppers buy more frequently on competitor platforms: Average purchase frequency is 23 times per year on challengers compared to 13 times per year on Amazon.
GMV per buyer is increasing faster for challengers: Both Amazon and rivals see a GMV of US$578 per year per buyer, but challengers’ growth outpaces Amazon’s.
When it comes to third-party (3P) GMV marketplaces (platforms where external sellers drive sales), Amazon has long been the undisputed leader. But recent trends suggest that the e-commerce giant’s dominance is being actively challenged by other top marketplaces.
Looking specifically at 3P sales, our ECDB Revenue Equation reveals why competitors are gaining ground.
Even though Amazon is the largest e-commerce retailer worldwide and its total market share (including marketplace and online store revenues) is growing, the 3P only business is coming under increasing pressure from challengers.
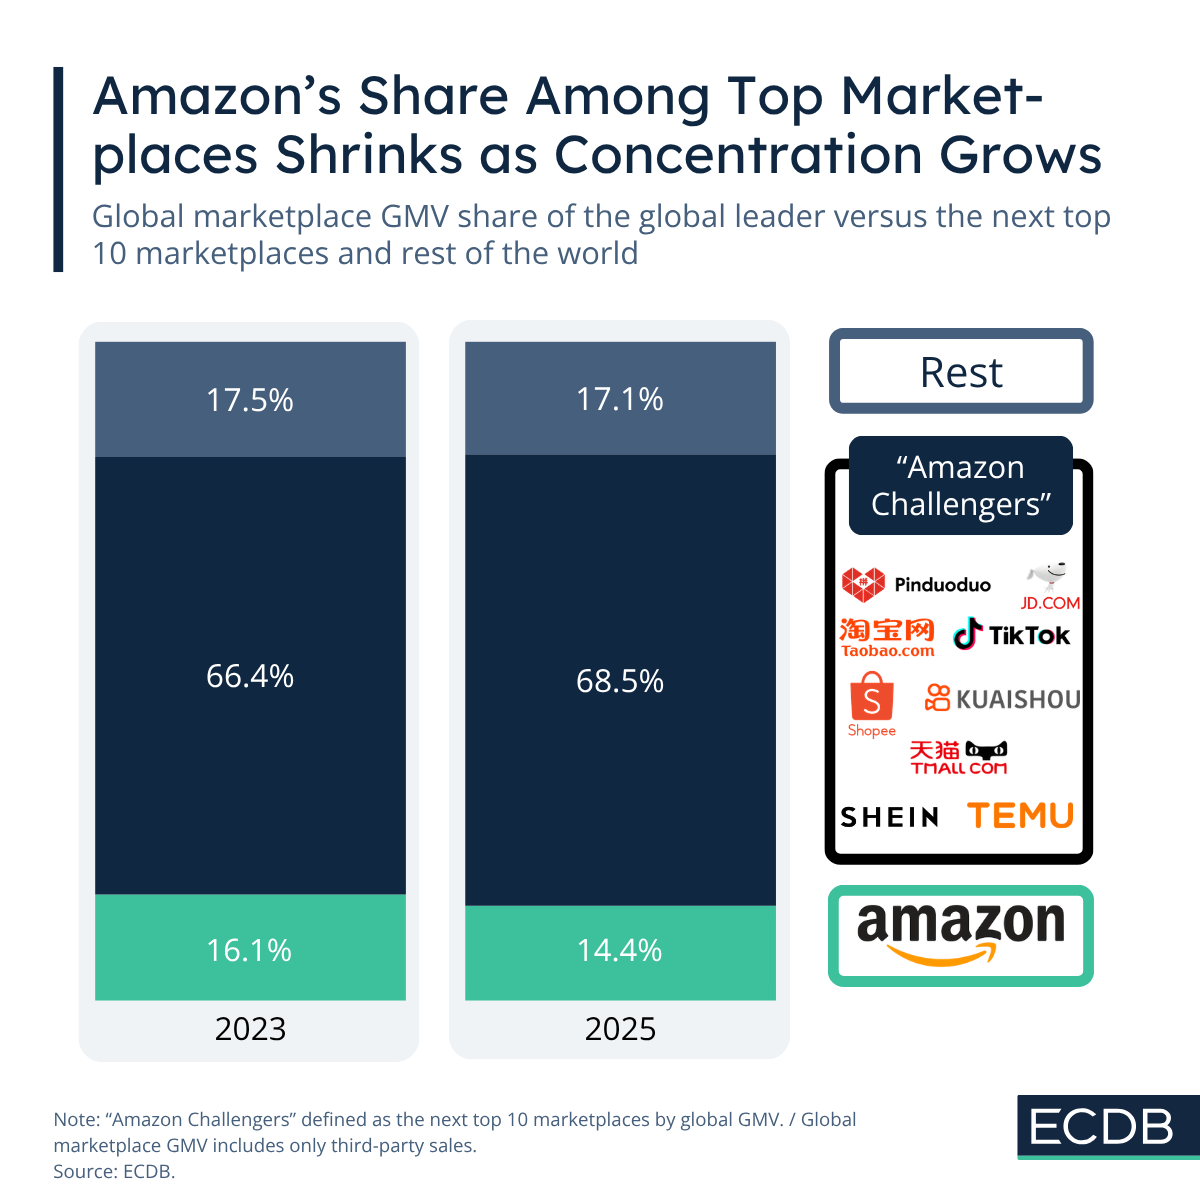
In 2023, Amazon marketplace 3P GMV accounted for 16.1% of the global top 100 marketplaces. Just a few years later this share declined to 14.4% and the remaining marketplaces in the top 10 (Amazon's challengers) gained in market share.
The ECDB Revenue Equation shows which factors contribute to the competitors' massive growth.
Amazon still boasts the largest buyer base, with 1.46 billion buyers in 2025. However, the CAGR (compound annual growth rate) of other top marketplaces is more than triple Amazon's CAGR, at 13.8%. Even though the challengers' average number of buyers is at 683 million, and therefore much lower than Amazon's, the rivals are catching up fast.
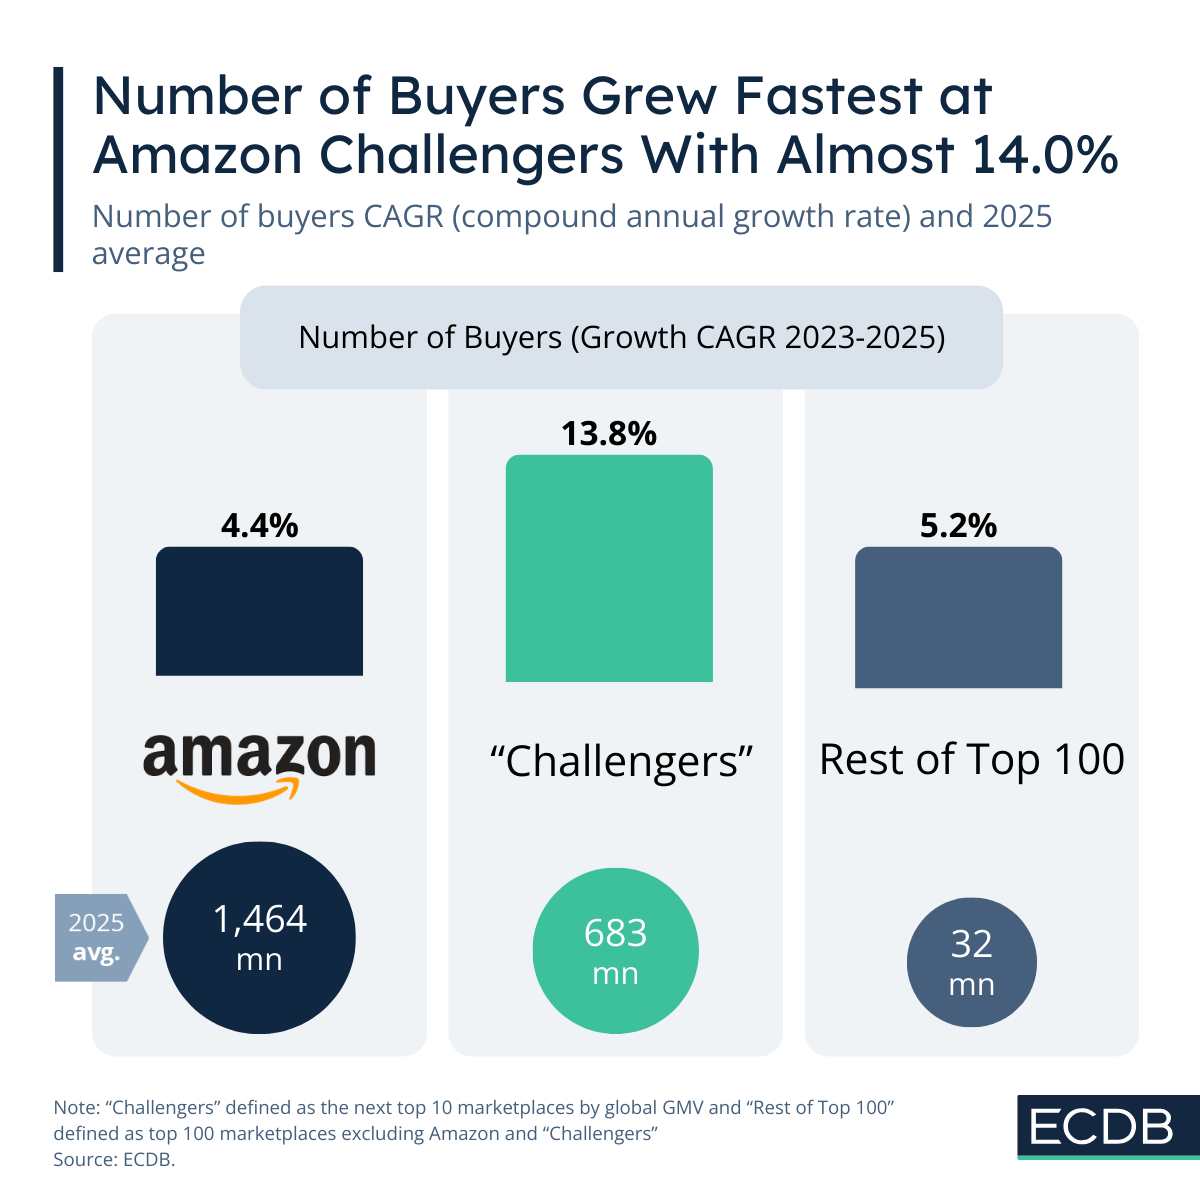
The rest of the top 100 marketplaces are much further behind the top 10, at an average number of 32 million and a CAGR of 5.2%.
The average Amazon buyer purchases 13 times a year at Amazon. In contrast, shoppers on rival marketplaces are buying 23 times annually. Purchase frequency on these challengers is growing at 5.8% per year, signaling a highly engaged customer base.
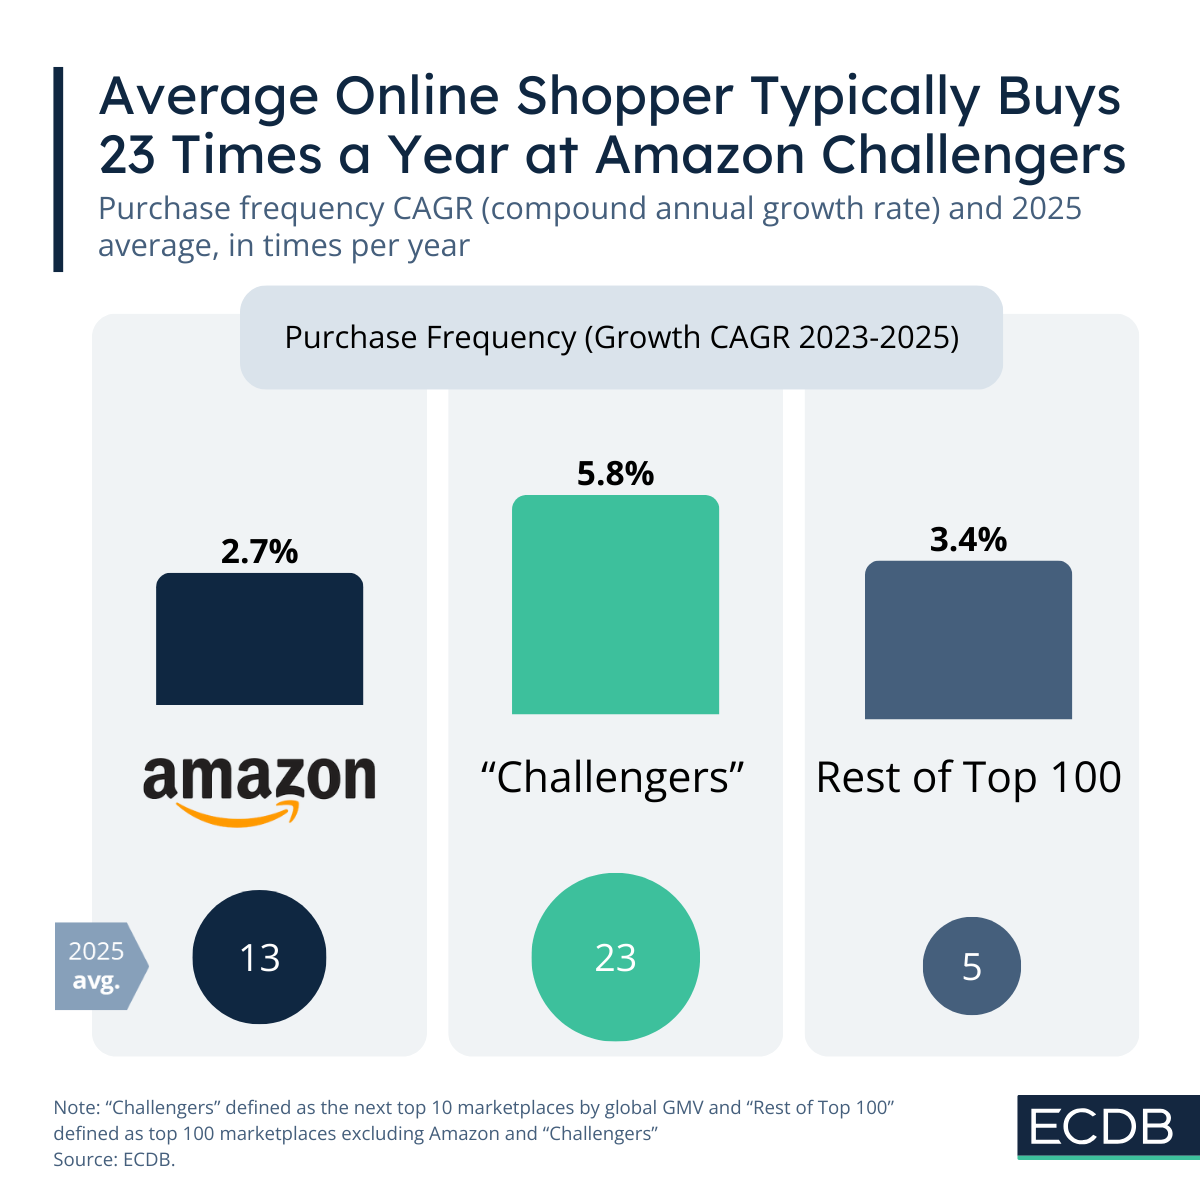
For the rest of the top 100 marketplaces, shoppers buy on average 5 times a year, at a CAGR of 3.4%.
Both Amazon and its challengers currently see roughly US$578 in annual spend per buyer. But the competitors are outpacing Amazon in growth, at 6.3% versus 4.2%, which indicates that the challengers are catching up not just in buyer count, but also money spent.
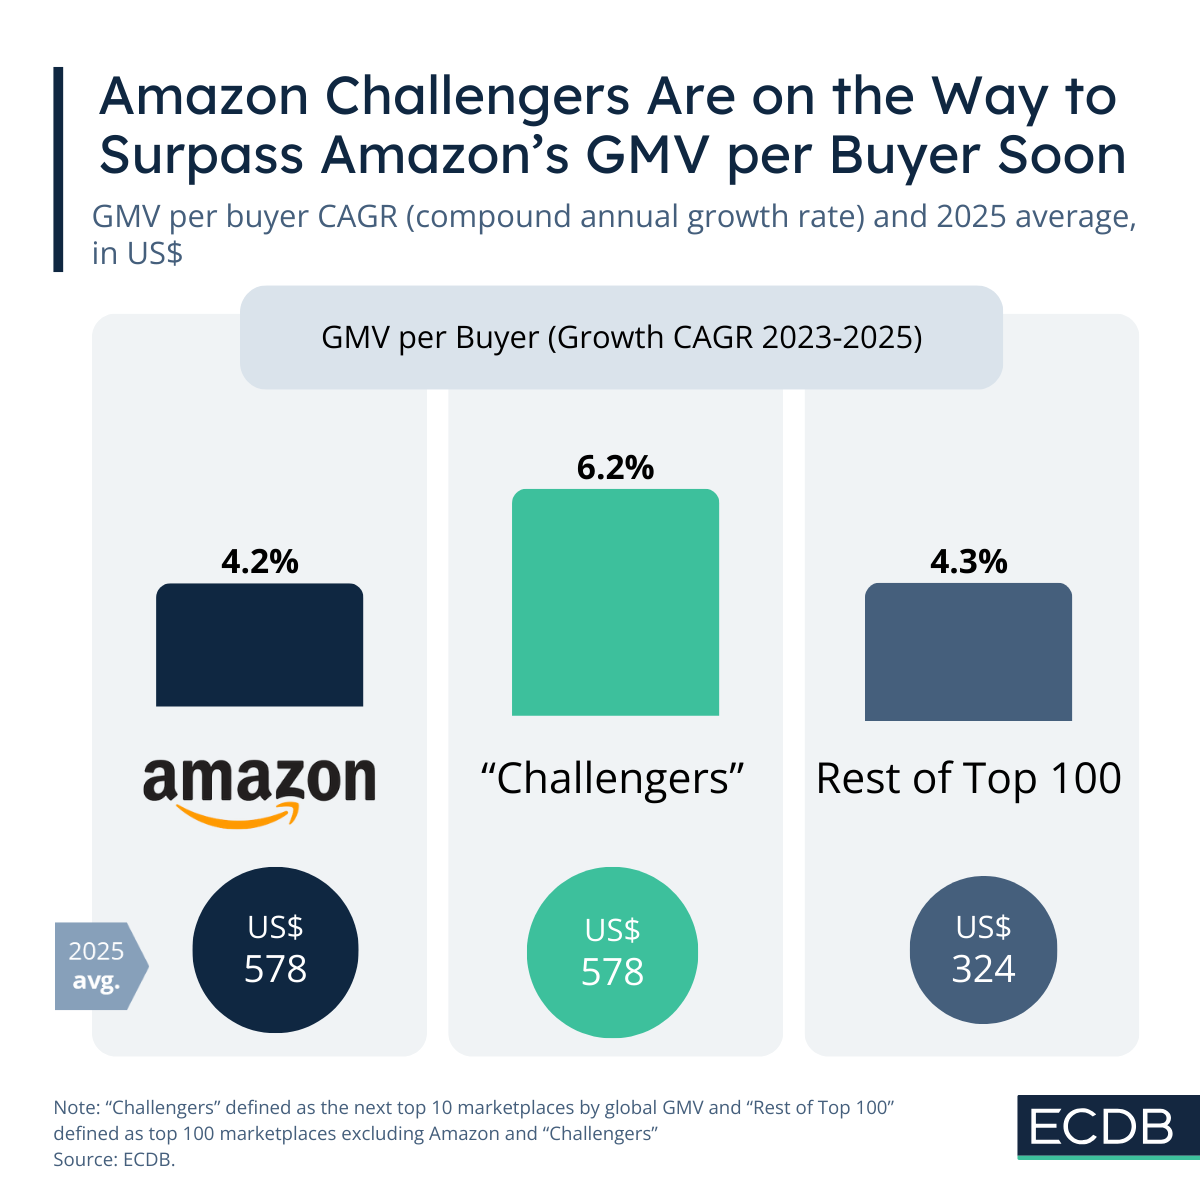
Again, the rest of the top 100 are behind, at US$324 spent per year and a CAGR of 4.3%.
Amazon remains the dominant e-commerce marketplace, but its leadership in third-party GMV is under pressure. Competitors are rapidly increasing their buyer base, driving higher purchase frequency, and accelerating GMV growth per buyer. For Amazon, the message is clear: dominance today doesn’t guarantee dominance tomorrow.

Related Articles
Electronics is not just consumer tech, as the top 100 retailers in the US market show. Here is who's behind the United States' largest category.
In the global top 10 ranking, Amazon holds the number one spot, yet it is still outnumbered. Players like Pinduoduo, Douyin, Taobao and Tmall follow close behind. Together with the others, they account for 80% of this top ranking.
Of the 30 fastest growing marketplaces, 17 have a third-party share of over 80%. This hints at a future of platform ecosystems over inventory-led business models.
Click here for
more relevant insights from
our partner Mastercard.
Book a demo to see how ECDB's market intelligence can support your business.