Zara.com has recently surpassed H&M (hm.com) to become the higher-selling fashion online store. Where H&M experienced declines after the pandemic, Zara’s eCommerce business grew to reach US$6.6 billion in 2024, compared to hm.com’s US$5.0 billion.
Revenue analysis offers multiple advantages that other indicators cannot. Additionally, ECDB now provides a more in-depth view of revenue development than ever before.
We at ECDB now offer data on the consumer end of the equation. The view includes purchase frequency and the number of buyers. This means we can discern how many consumers buy from the retailer and how often they do so in a year.
At the example of zara.com, this post illustrates how the two variables can deepen retailer analysis. As Inditex’ flagship brand, which has thrived in recent years, Zara is a good study for examining this development.
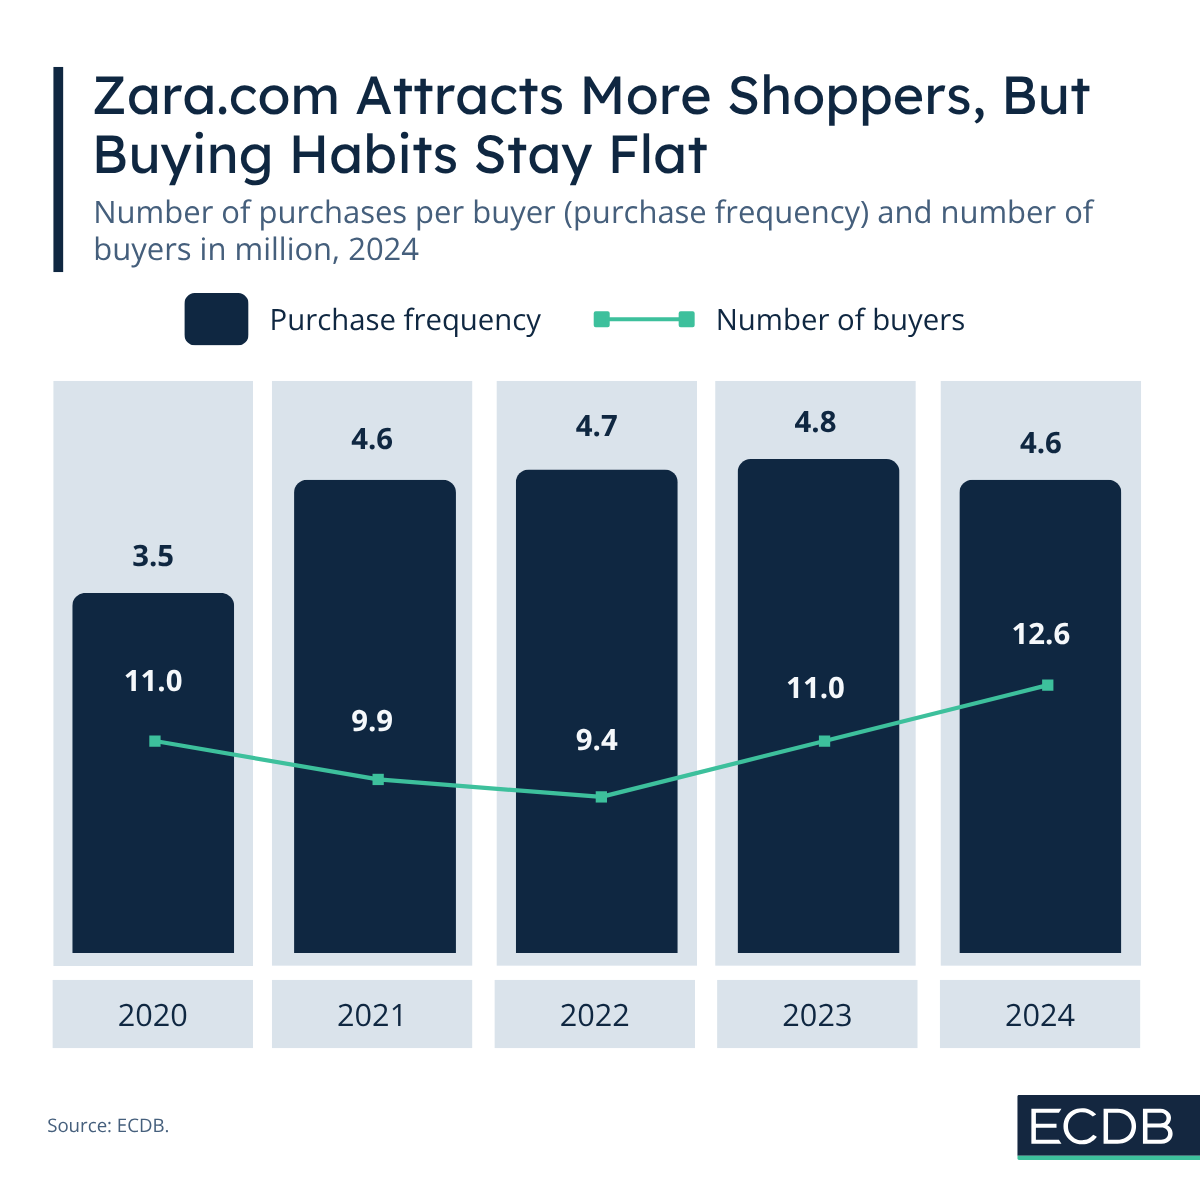
On Average, Consumers Bought 4.6 Times on Zara.com in 2024
Purchase frequency measures how often the average consumer buys from the platform in question each year. A higher rate indicates customer loyalty and product appeal, which typically means users will soon purchase again.
In the case of zara.com, purchase frequency increased in the mid-term from an average of 3.5 times a year per user in 2020 to 4.6 times a year in 2021. Since then, the number has grown only marginally, reaching 4.7 times in 2022 and 4.8 times in 2023.
Purchase frequency decreased slightly to 4.6 in 2024. However, this variable acts in conjunction with the number of buyers, so it is not the whole story. Together, they determine revenue development.
The Combination of the Number of Buyers and Purchase Frequency Provides Insight Into Revenue Development
The number of buyers describes how many consumers bought products from this platform in a given year. It acts in conjunction with the previous variable, purchase frequency. The size and interaction of these two indicators ultimately affect revenue.
In 2020, 11 million customers purchased products from Zara.com, averaging 3.5 purchases per customer per year. This number decreased slightly in subsequent years, with 9.9 million and 9.4 million buyers in 2021 and 2022, respectively. In combination with the growing purchase frequency, revenue fluctuated.
2023 was a key year for zara.com. Revenues surged, and Zara surpassed H&M’s online domain to become the more popular online platform. This was due to an increase in shoppers to 11.0 million, with an average purchase frequency of 4.8 times per year.
In 2024, the combination between number of buyers and purchase frequency improved further. Although purchase frequency decreased slightly, the number of buyers increased from 11.0 million to 12.6 million. This resulted in an increase from US$6.3 billion in 2023 to US$6.6 billion in 2024.
Purchase Frequency and Number of Buyers Reflects Zara.com’s Success Over the Past Few Years
Overall, the purchase frequency and number of buyers view on ECDB provides a deeper glimpse into how revenue development came about. It introduces the consumer side into the equation, which together with transaction data such as number of annual orders fills in blank spaces of retailer profiles.
Despite physical store re-openings, inflation, and competition from lower-cost platforms, zara.com has had astonishing development over the past few years. The brand has managed to combine durable styles with fair prices to cater to a wider audience, as evidenced by the increase in online customers over the past few years.