We’ve all heard it before – China is the number one eCommerce market with over a trillion U.S. dollars in 2024, while the United States lag behind. Up-and-coming markets in Latin America and other regions in the world are also widely discussed, but what happens when we take population size into account?
Adding one more variable – population – to the usual country rankings produces a list that looks a little different than the usual one. In this version, the United States takes over the ranking, leaving China far behind.
Why Per Capita Figures Are Important
The United States and China are being constantly compared in terms of market size and leading players, but not always in terms of population.
China is about three times the size of the United States. With a population count of over 1.4 billion people, it is the second largest country in the world, only recently surpassed by its enormous neighbor India. As a result, China's number one position shifts when market revenue is divided by population.
The United States takes over that ranking position in a per capita chart. It is the national average and should not be taken too literally – more like a rough estimate – because the population count includes all non-consumers, i.e. all minors and those who do not participate in the online economy at all.
So, on average, how much does each person in each market spend on eCommerce?
Per Capita Revenue Is Highest in the United States
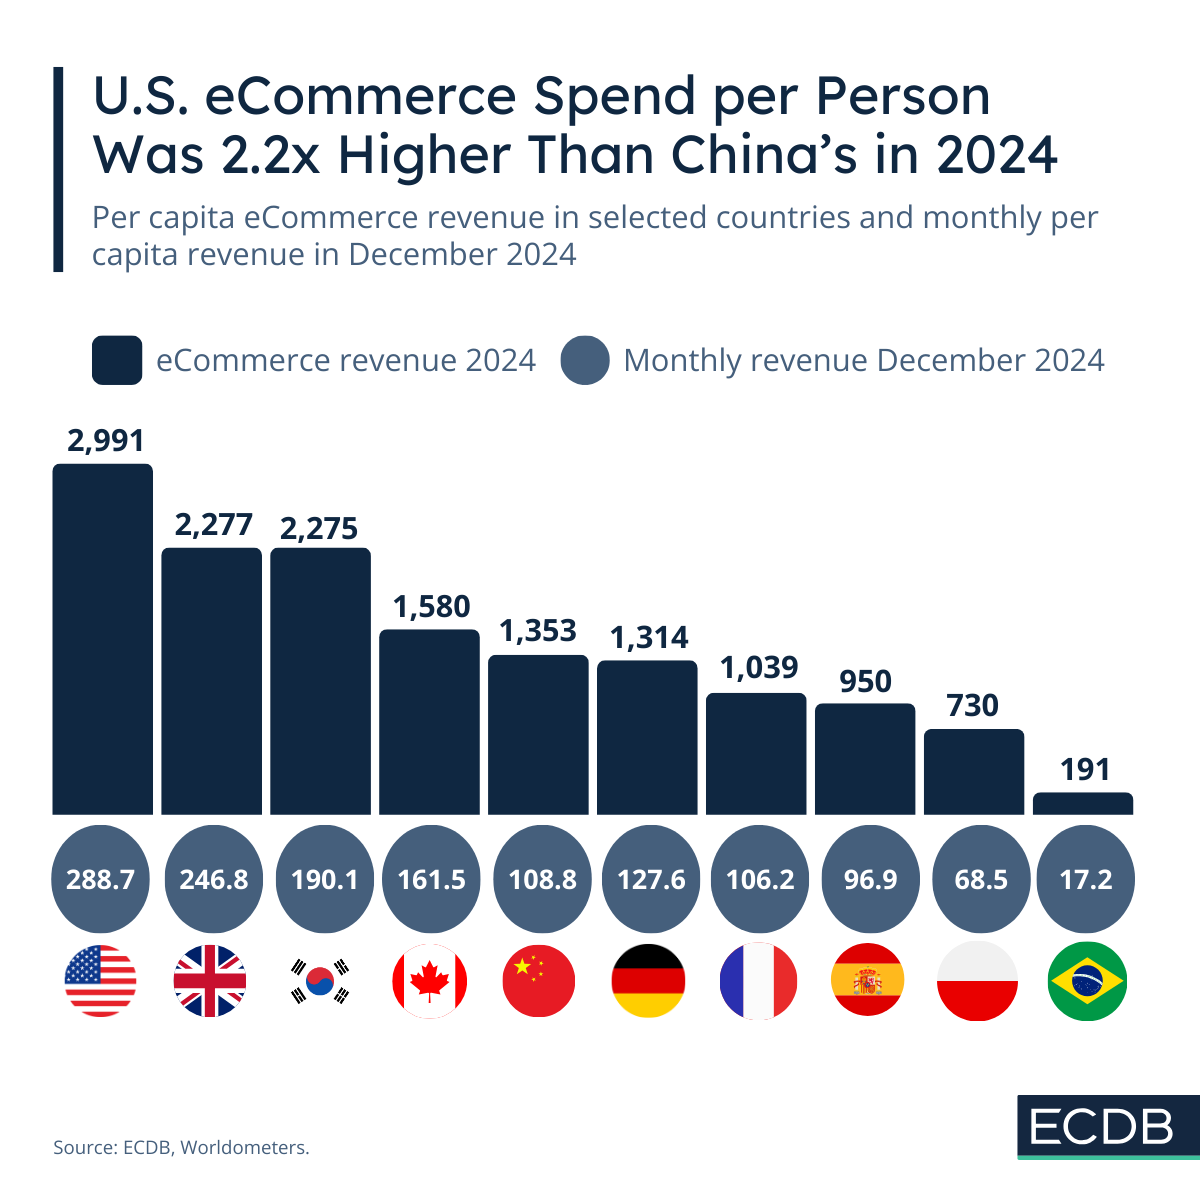
For the entire year of 2024, each U.S. citizen spent an average of US$2,991 on eCommerce purchases. In the month of December, the average was US$288.7. This monthly figure accounts for a relatively high share of eCommerce spending in December, given major holidays such as Christmas and all that goes with it .
With this figure, the United States has the highest per capita eCommerce spending of any country. The following markets rank lower in terms of annual eCommerce spending. These are not necessarily the top 10 countries; just select ones we considered relevant for the analysis.
In fact, China is far behind the countries it usually easily surpasses due to its population size – with an annual eCommerce spend of US$1,353 in 2024, it is lower than the average Canadian and barely surpasses the German average of US$1,314. In the month of December, each person in China spent an average of US$108.8, which is lower than the German monthly average of US$127.6 in that month. Emphasis on other days during the year for shopping plays a major role in this difference.
Per Capita Spending Highlights Cultural Patterns
Spending differences in December 2024 derive from varying monthly revenue shares – each country has a different percentage of revenues spent in that month, which varies due to cultural habits and the occurrence of major shopping events.
With emerging markets at the bottom of the list, population size has a deep impact on how eCommerce revenues appear. See Poland, for example, with an annual per capita revenue of US$730 and a December 2024 figure of US$68.5. Brazil is a vast country with a population of over 200 million. Its considerable eCommerce revenue shrinks to US$191 per capita, with a December value of just US$17.2.
It is therefore reasonable to always consider the per capita value when looking at large or emerging eCommerce markets.