Article in a Nutshell:
Amazon.com customers place 21.95 orders a year, up to ten times more often than shoppers on single-category specialists like Chewy.com (6.91) and Sephora.com (2.11).
Chewy.com and Sephora.com post higher order values (US$85.60 and US$75.80) than Amazon.com (US$72.80), but the higher basket doesn't make up for how rarely those customers return.
Target.com sells across the same seven categories as Amazon.com, yet its customers still buy only 4.67 times a year, which shows that offering many categories only works when something else brings shoppers back.
The strategy that converts best is cross-category selling, offering customers a reason to return for something completely unrelated to their last purchase, rather than just deepening the range within one category.
The data makes the case clearly: Amazon's customers buy far more often than shoppers at focused specialists, even though those specialists charge more per order.
But the comparison also shows that breadth by itself is not the full answer. Target carries a similarly wide spread of categories and still converts far less often, which means the retailers that win at cross-selling are combining category breadth with something that gives customers a routine reason to come back.
The Strategy That Wins: Selling Across Categories, Not Deeper Into One
Amazon's customers place 21.95 orders per year on average, the highest purchase frequency of any store compared here. That number comes from a catalog spread across seven top-level categories, Electronics, Hobby & Leisure, Fashion, Furniture & Homeware, Care Products, DIY, and Grocery, with no single category making up more than 38% of total revenue. A customer who buys electronics one month has a reason to come back for a home item the next, and a grocery order after that, all on the same store.
That is the mechanic behind cross-category selling: every new category is a new reason for an existing customer to return, rather than a new customer to acquire. It converts best because it multiplies purchase occasions instead of just the odds of a bigger cart.
The Trade-Off Specialists Accept: Bigger Baskets, Fewer Visits
A bigger basket sounds like a win, but it doesn't make up for how rarely that customer comes back. Chewy sells almost nothing outside Pet Supplies (100% of its revenue) and posts an average order value of $85.60, the highest of the four stores compared here.
Sephora is nearly as concentrated, with 98.4% of revenue from Care Products, and an AOV of $75.80. Both numbers beat Amazon's $72.80 average order.
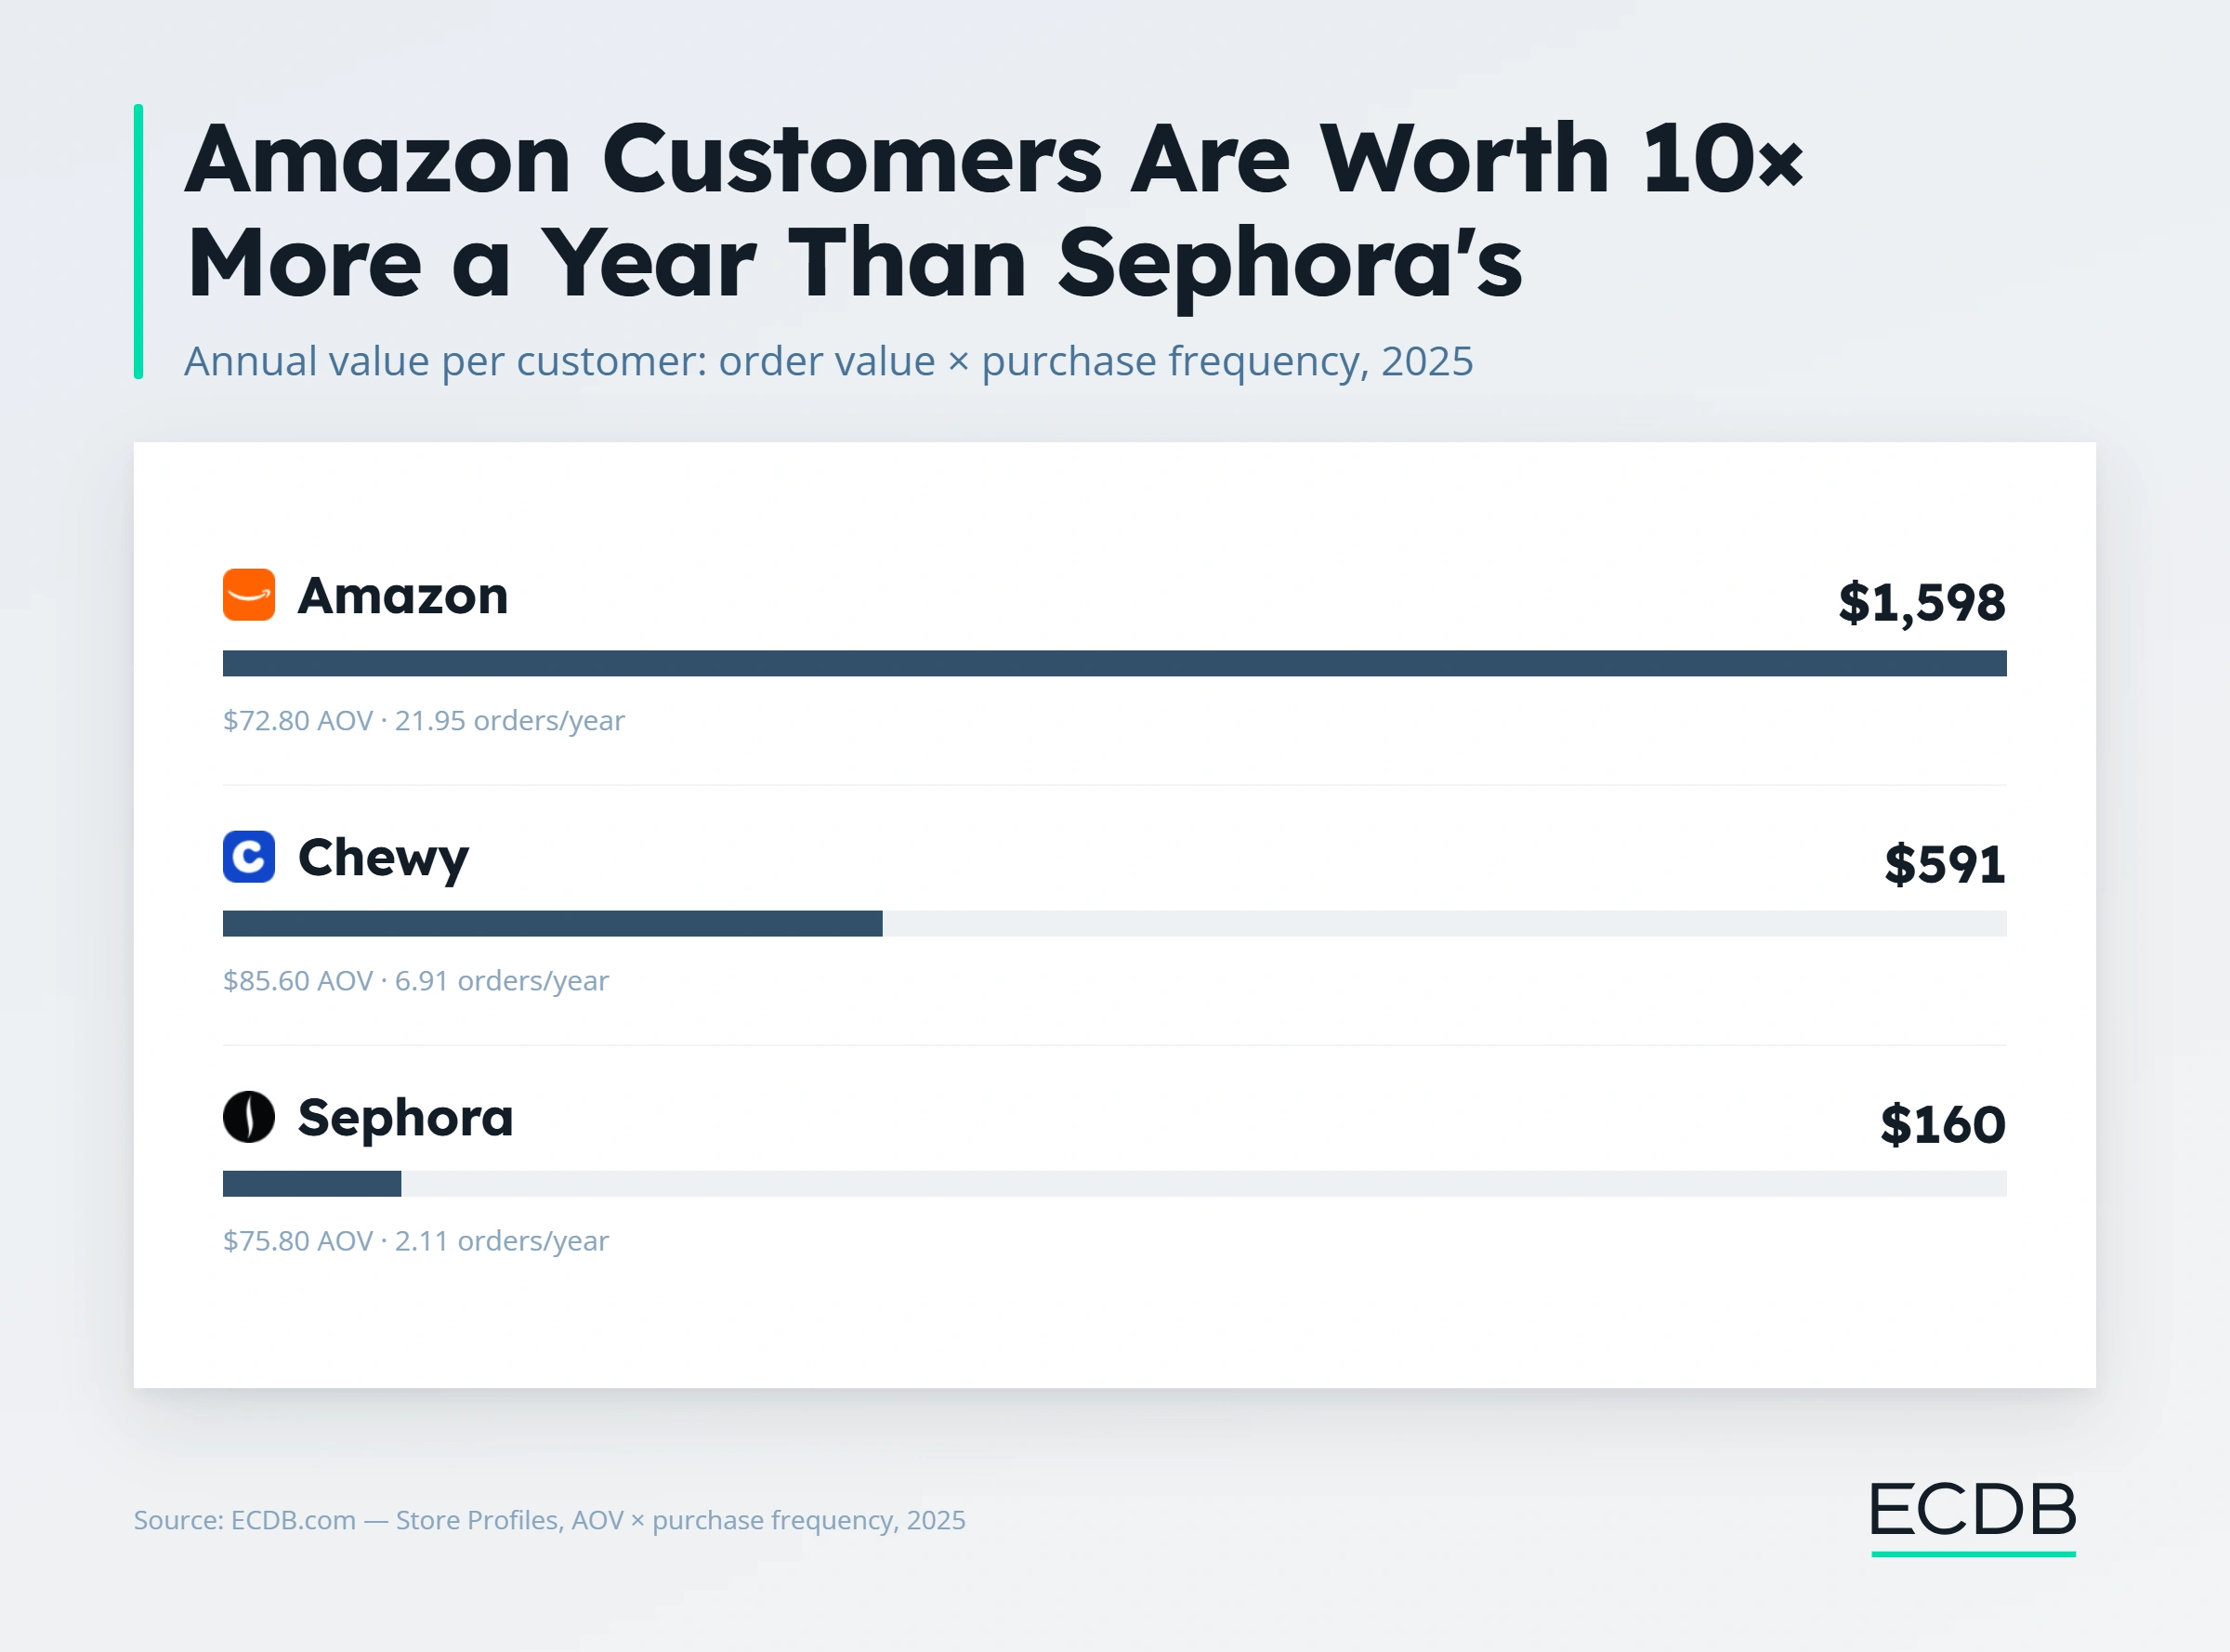
The gap closes, and then reverses, once purchase frequency enters the picture. Multiplying average order value by how many times a customer buys per year gives the actual amount that one customer is worth annually:
Amazon: US$72.80 per order × 21.95 orders a year ≈ US$1,598 per customer, per year
Chewy: US$85.60 per order × 6.91 orders a year ≈ US$591 per customer, per year
Sephora: US$75.80 per order × 2.11 orders a year ≈ US$160 per customer, per year
A Chewy customer spends more per order than an Amazon customer, but is still worth barely a third as much over a year, because Amazon sees that customer so much more often. A Sephora customer, despite a similarly high order value, is worth only about a tenth of what an Amazon customer brings in.
The bigger basket looks like the stronger result until it's set against how many times that basket actually gets filled.
Why Category Breadth Alone Is Not Enough
Target is the case that keeps this framework honest. By category breadth alone, Target should convert closer to Amazon's rate. Instead, its customers buy only 4.67 times a year, closer to Chewy than to Amazon.
The difference is what happens after the categories are in place. Amazon pairs its breadth with mechanics that create routine:
fast, predictable delivery,
membership perks,
and recommendations that surface the next relevant category before the customer goes looking elsewhere.
Category breadth creates the opportunity to cross-sell but those mechanics are what actually convert that opportunity into a repeat order.
Target's Categories Are Actually More Balanced Than Amazon's
The Amazon-Target comparison gets more surprising once the category mix itself is broken down. Amazon's catalog looks broad on paper, but two categories, Electronics (38.31%) and Hobby & Leisure (32.09%), already account for more than 70% of its revenue between them. Target's spread is flatter: its top two categories, Hobby & Leisure (24%) and Fashion (22%), add up to only 46%, with the remaining five categories each still contributing a meaningful 4% to 15% share.
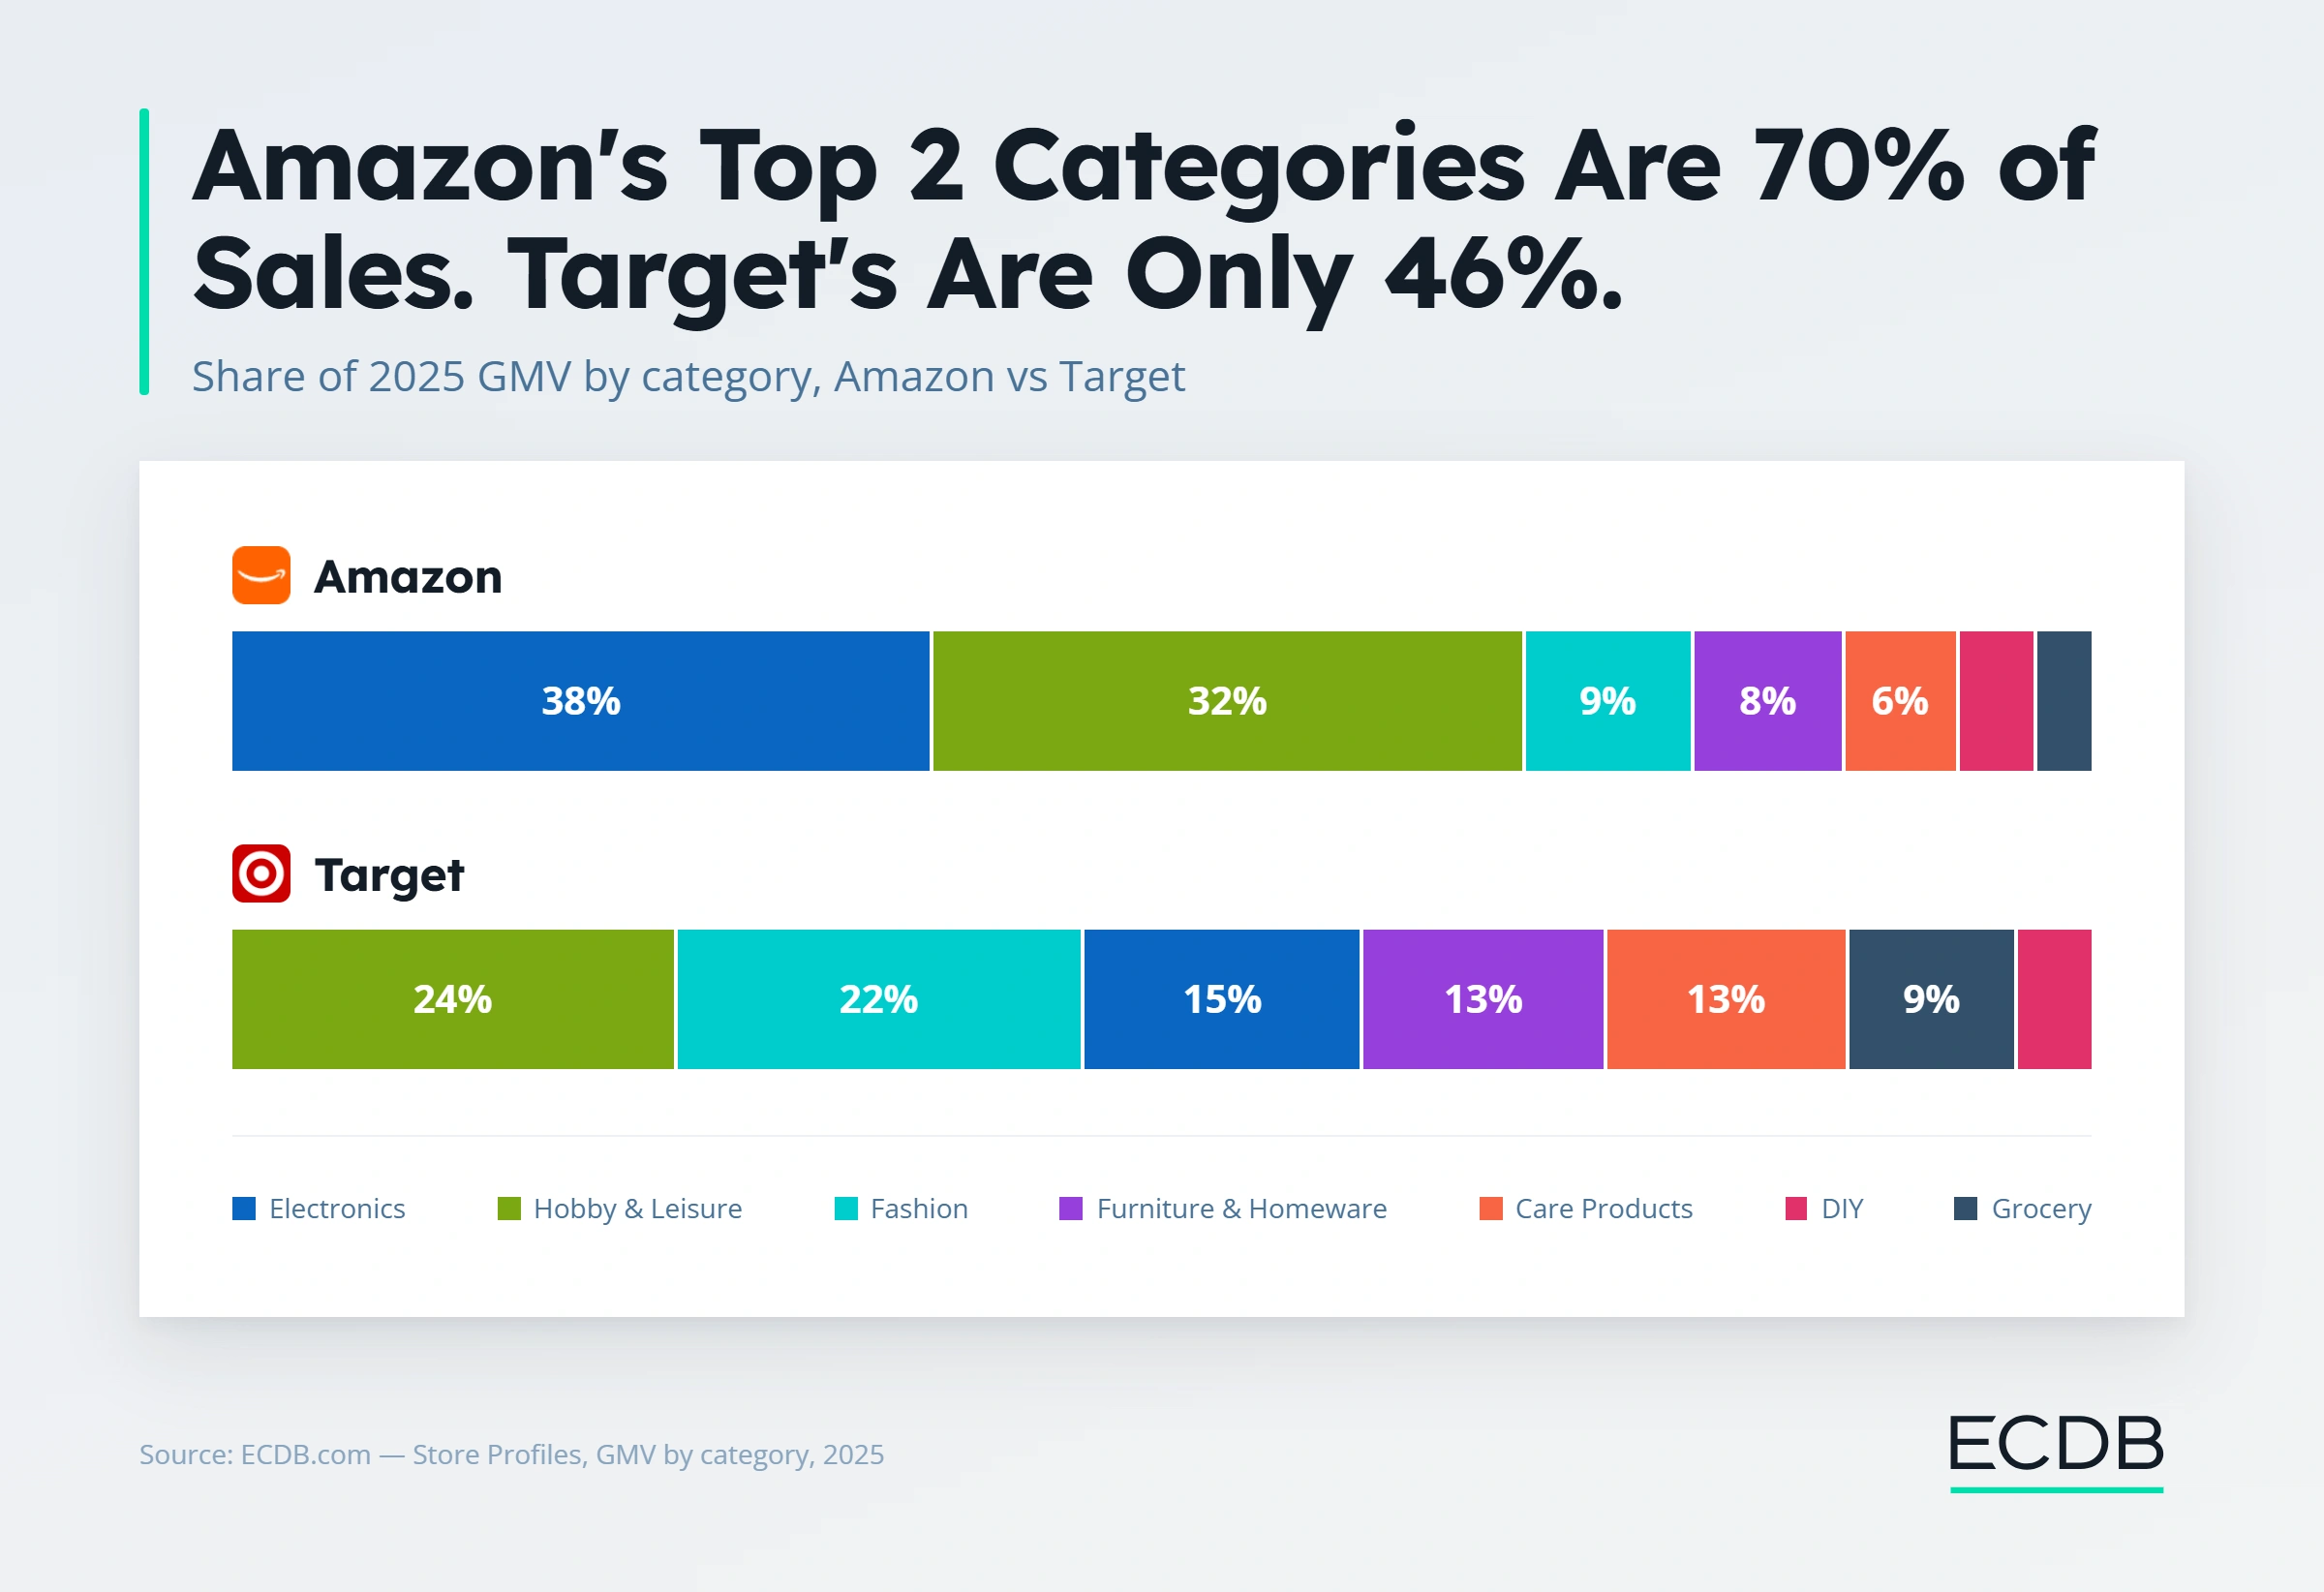
By the numbers, Target is the more genuinely diversified retailer of the two. And yet its customers still buy less than a quarter as often as Amazon's. That rules out an easy explanation for Target's lower frequency, it isn't that Target is secretly a specialist wearing a generalist's catalog. It carries the categories.
What it doesn't have is Amazon's delivery speed, membership structure, and recommendation engine turning that catalog into a reason to come back weekly rather than a few times a year.
The Gap Has Held for Four Years Straight
This isn't a one-year snapshot that happened to favor Amazon. Purchase frequency for all four retailers has barely moved since 2022: Amazon has stayed at 21.9 to 22.1 orders a year every single year, Chewy has crept up slowly from 6.53 to 6.91, Sephora has held between 2.09 and 2.25, and Target has stayed flat between 4.51 and 4.67.
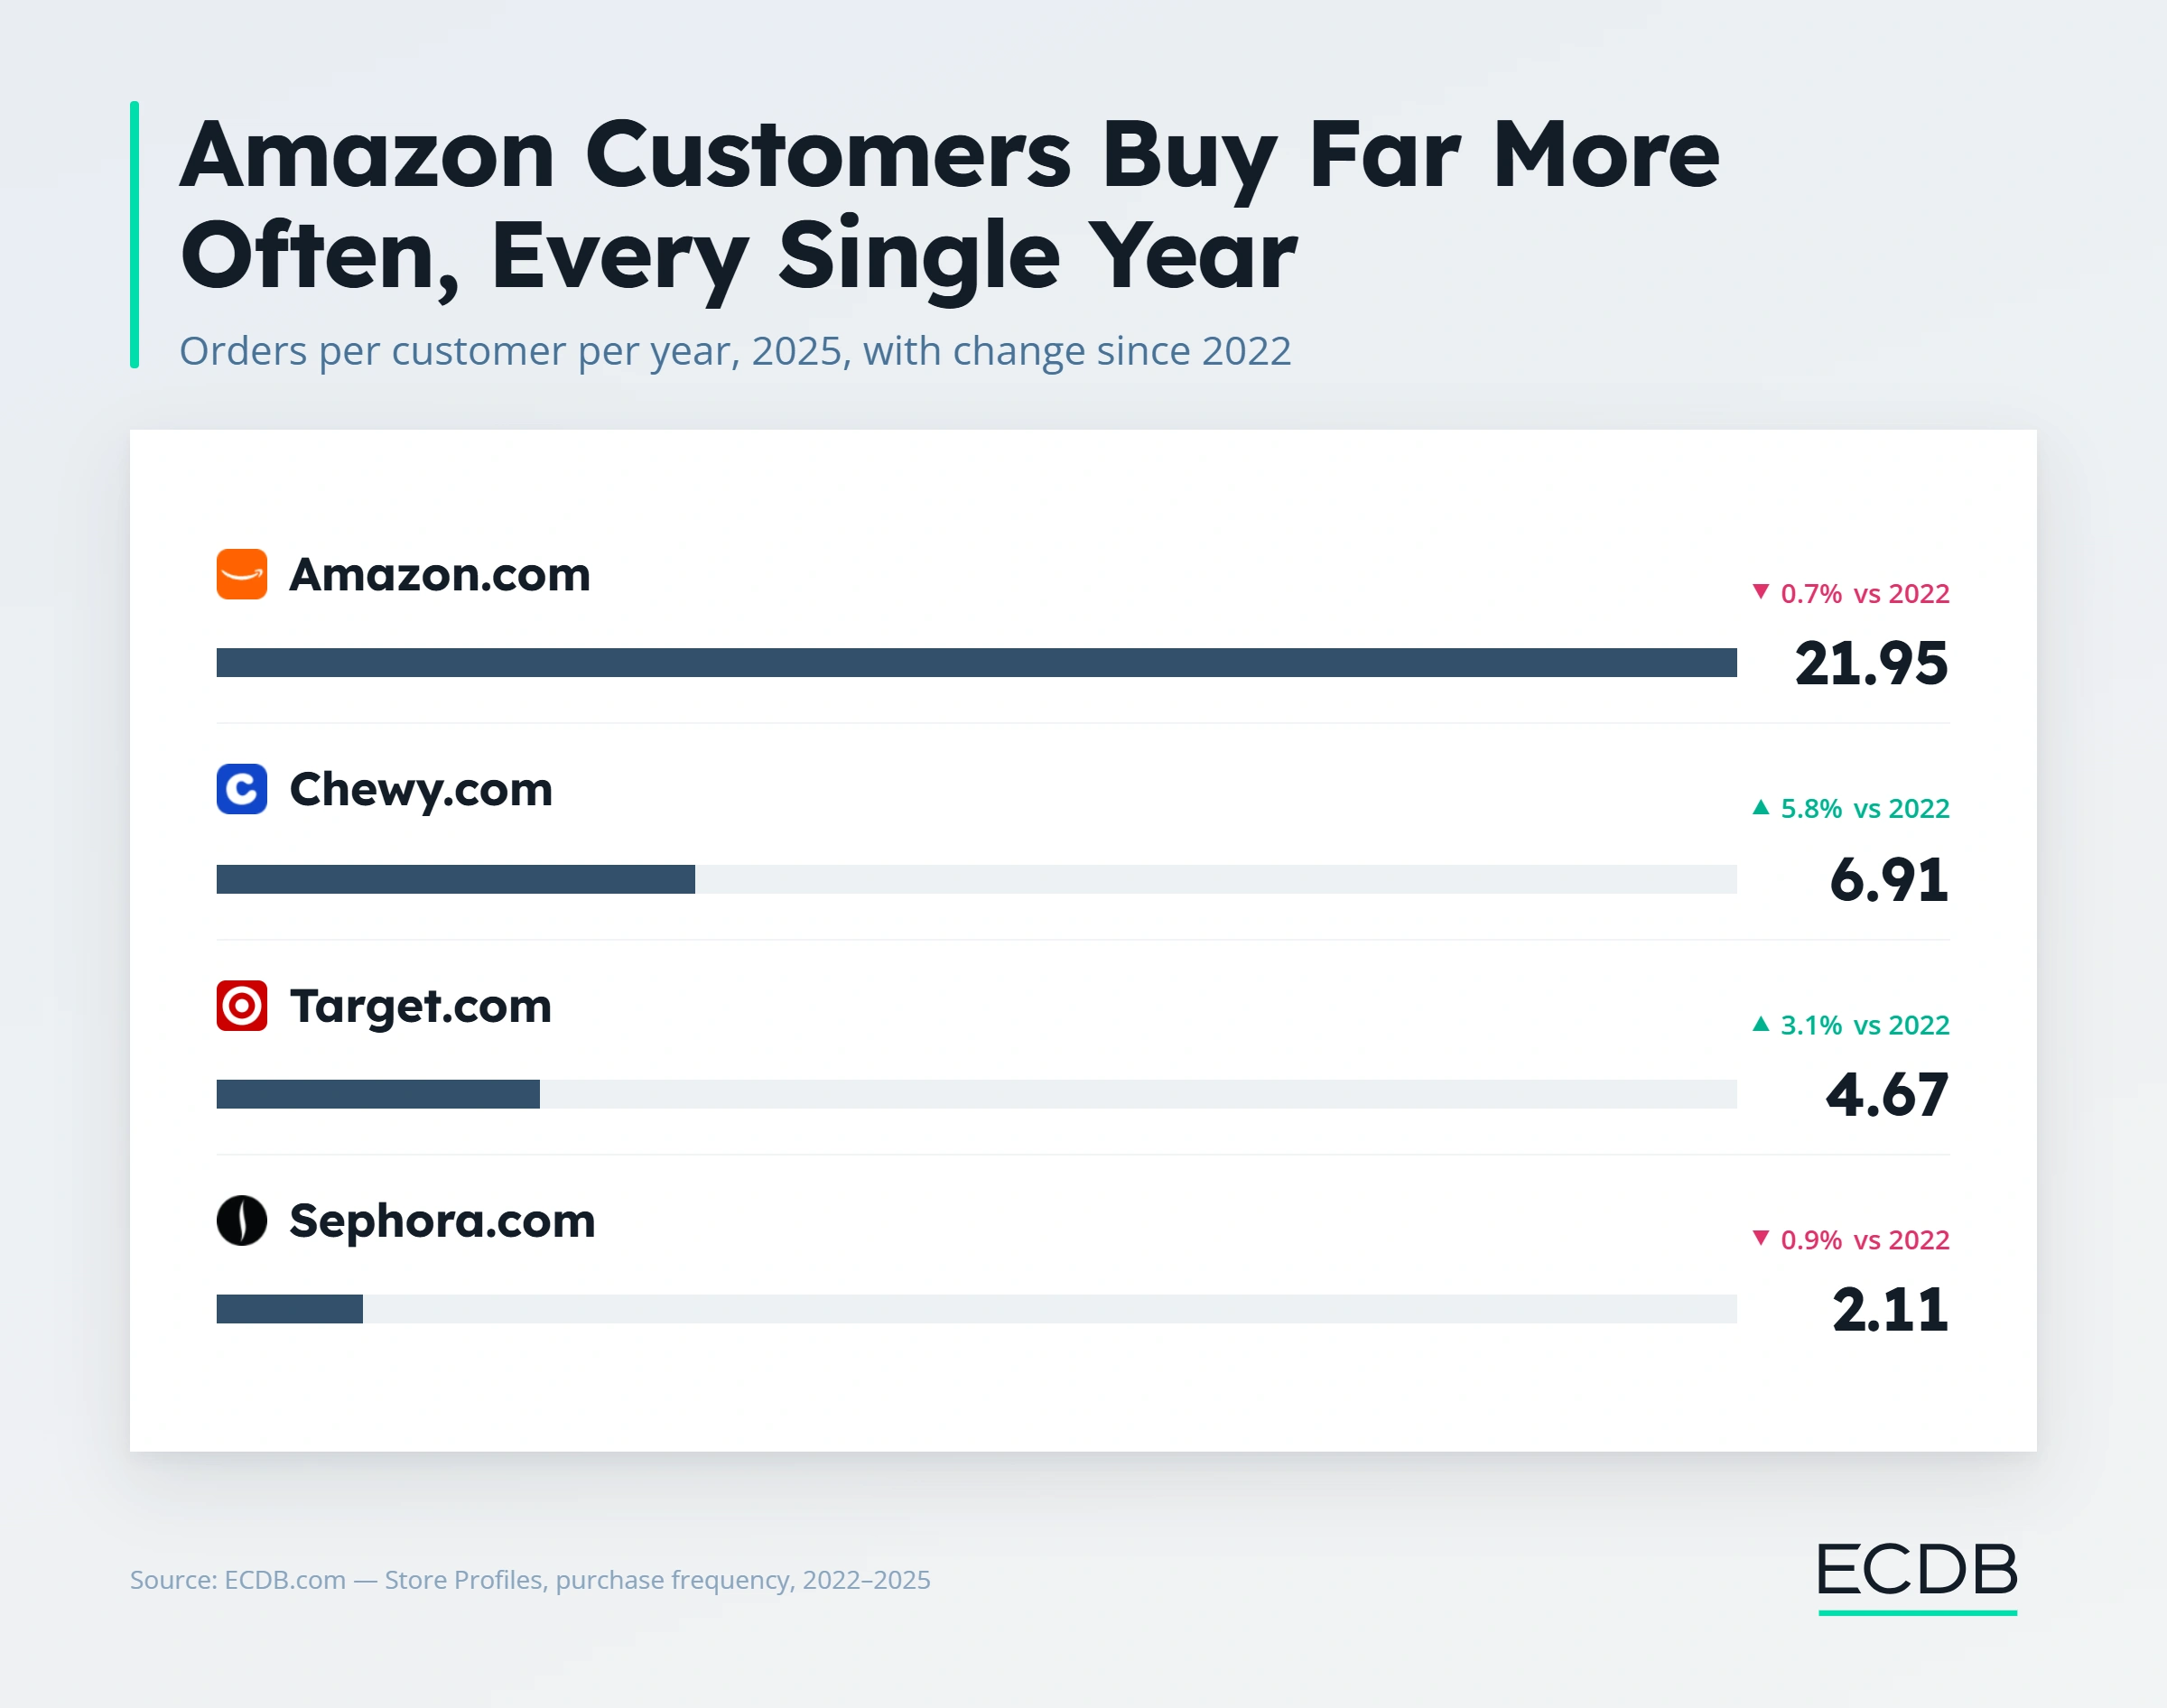
That stability matters more than any single year's number would. It means the gap between Amazon and the other three isn't a temporary spike or a fluke of one good holiday season, it's a structural difference in business model that has held steady for four consecutive years.
A cross-selling strategy built on category breadth and routine-forming mechanics doesn't just convert better once, it holds that advantage year after year.
How to Apply This to a Cross-Selling Strategy
The comparison points to three checks before betting on a cross-selling approach:
1. Look at how many genuinely different categories you sell, and make sure no single one is carrying the whole business.
The more real reasons a customer has to come back, the more often they will.
2. Track how often customers buy, not just how much they spend per order.
A high average order value can hide the fact that people simply aren't returning.
3. Give customers a reason to come back on a regular basis, like a membership, a subscription, or fast delivery.
Adding more categories won't do that on its own. You need something that turns "I could shop here again" into "I actually do."
How ECDB Grounds a Cross-Selling Strategy in Real Data
Every number in this article, purchase frequency, AOV, and category mix, comes from the same store-level data ECDB tracks for any retailer. That's the real value here: instead of guessing whether a new category will bring customers back, you can check what works using real market signals.
The same data works before, during, and after a cross-sell push: checking a potential partner's numbers before adding a category, seeing whether a rival's high AOV is real strength or just a sign customers aren't returning, and tracking frequency once a new category goes live to see if it's actually working.
That level of detail, broken down by store, category, and year, is available through ECDB's Profiles and Analyze & Compare tools for any retailer a brand wants to benchmark against.