

The Problem

Brands Are the Only Player in the Chain Without a View of the Market

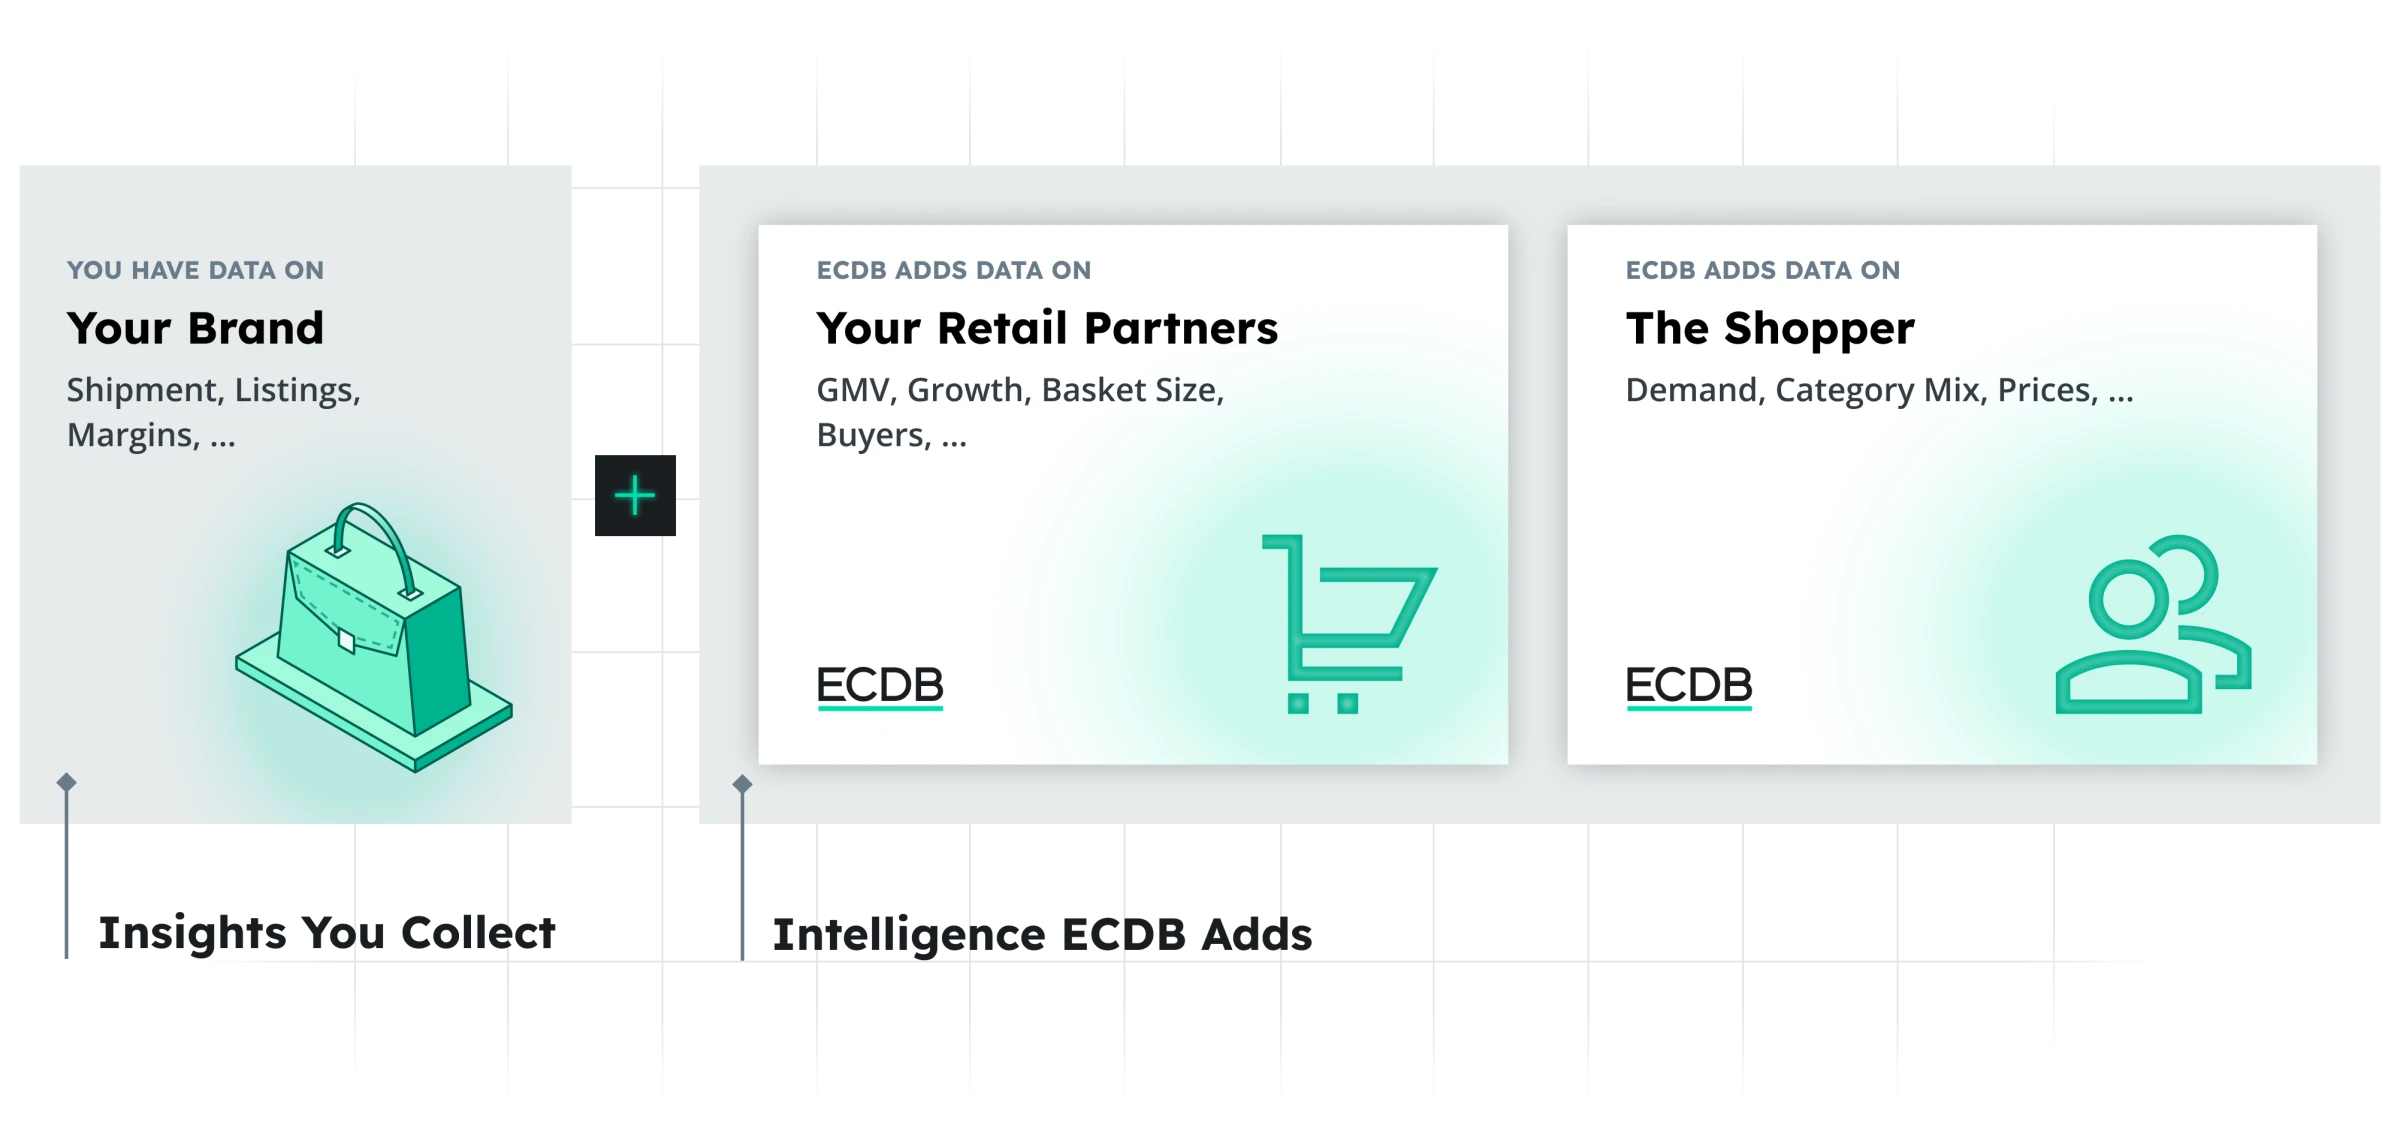
Retailers see their own sell out. Marketplaces see their own demand. Brands see shipments and listings, and then the trail goes cold. Everything past your own invoice reaches you second hand, and that blind spot hinders your decision-making.

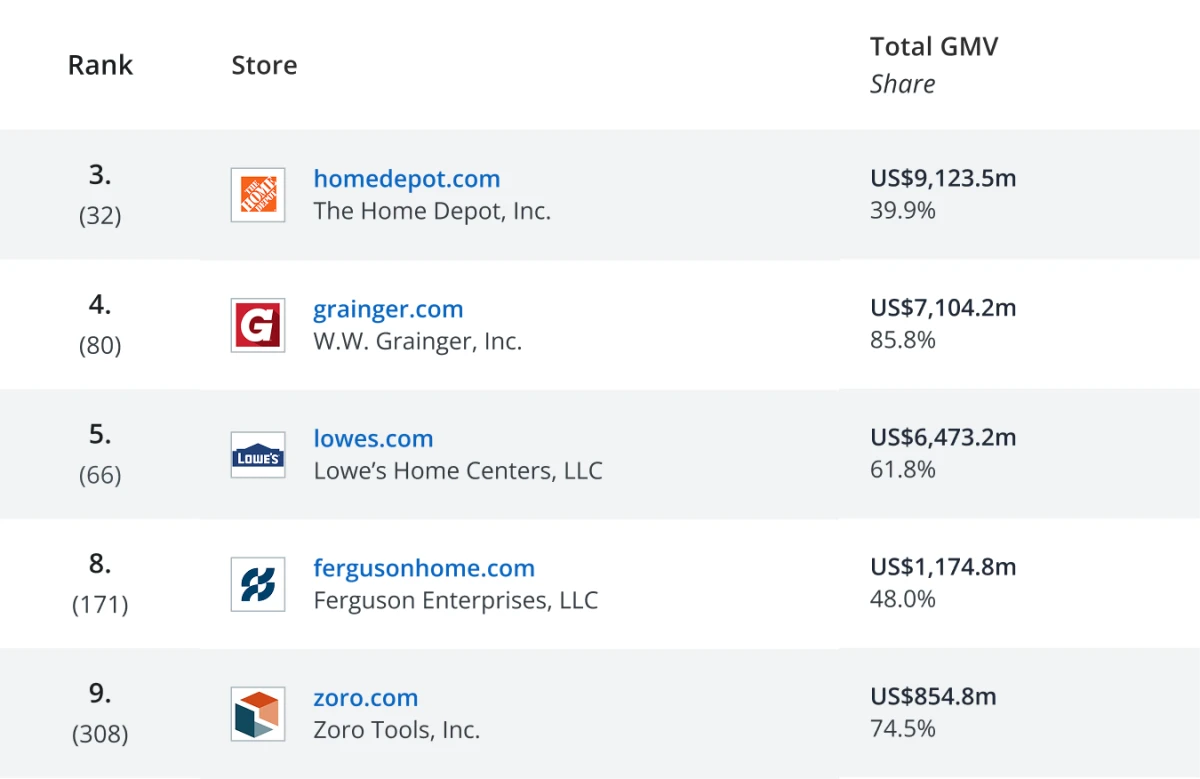
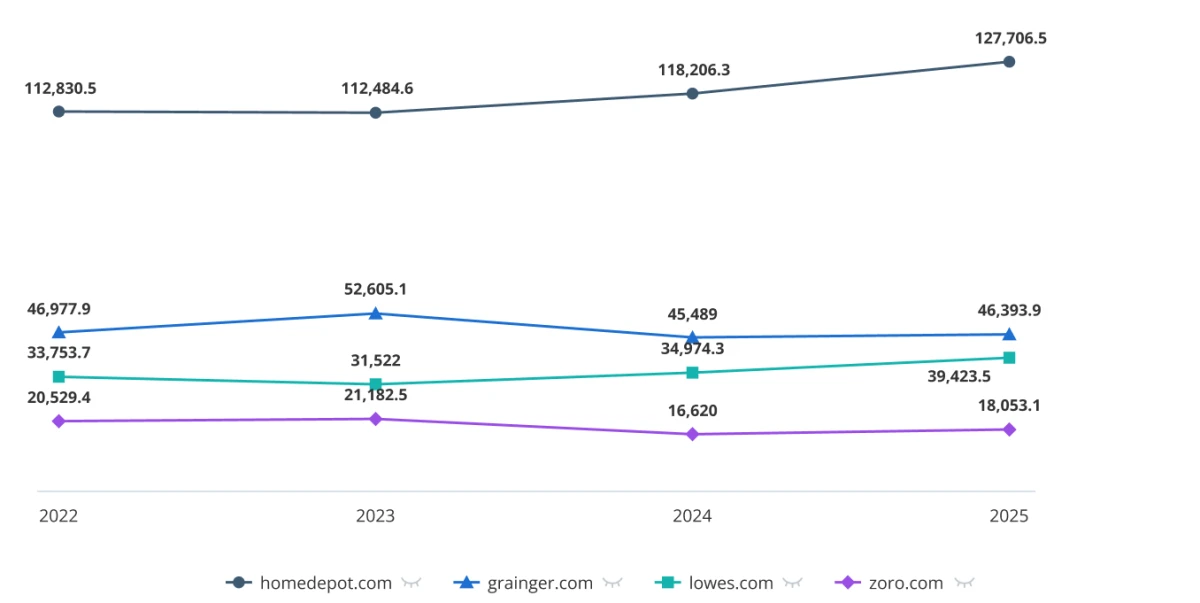
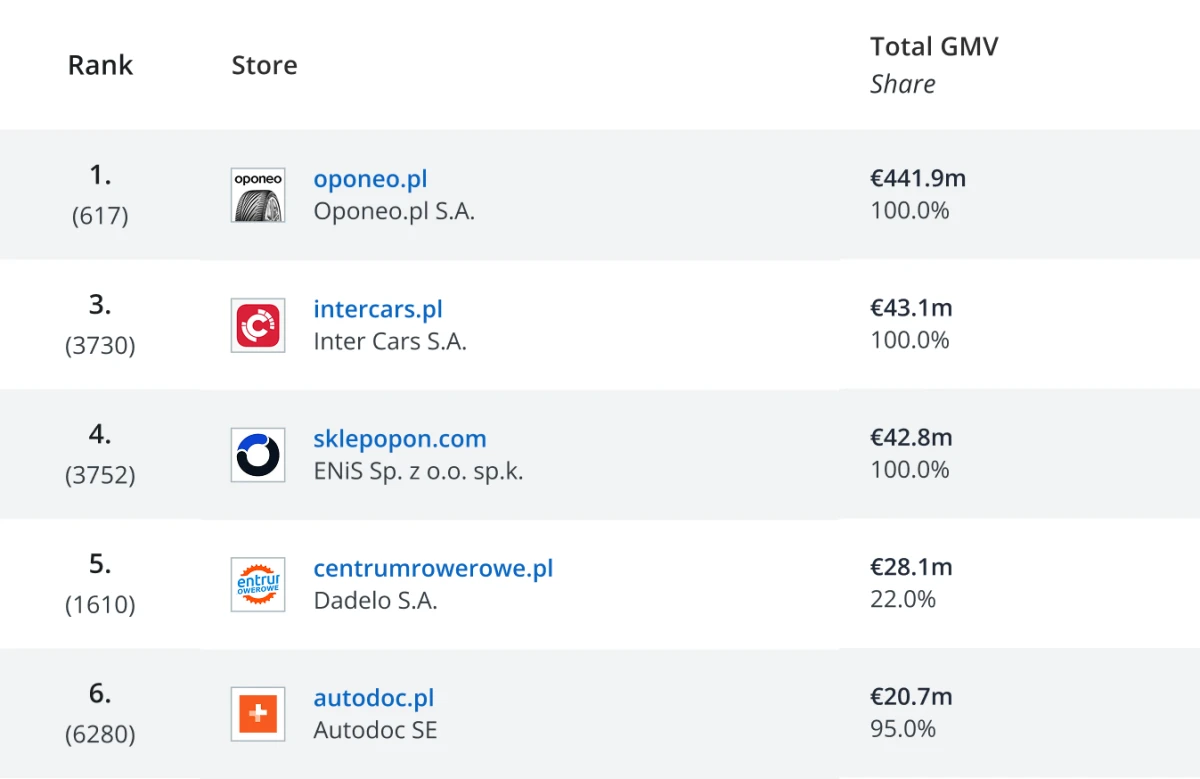
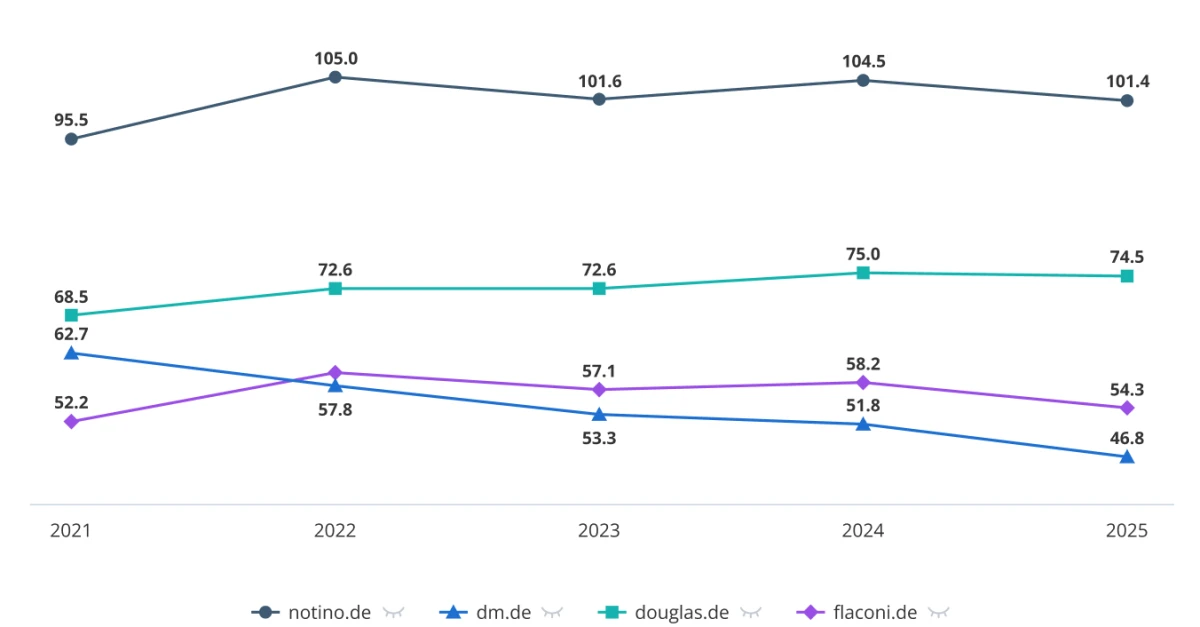
The data you already have, next to the data ECDB adds

What the Blind Spot Costs You

Without ECDB

Channel Priorities Set by Habit

Distribution plans follow the accounts you already know.

With ECDB

Channel Priorities Set by Growth

Know which retailers gained share in your category last year.

Without ECDB

Category Numbers Don't Hold Up

Different numbers because of inconsistent sources.

With ECDB

Category Numbers Everyone Trusts

One number, built on one consistent e-commerce definition.

Without ECDB

Negotiations Run on the Retailer's Data

Whoever brings the numbers frames the conversation.

With ECDB

Negotiations Run on Shared Facts

An independent source sets the tone for both sides.

Our Solution

We Model the Whole Chain, Not Only the Slice You Sit In

Everyone in e-commerce sees one slice. You see what you shipped, your partners see their own sell out, a marketplace sees its own demand. ECDB models the whole chain from the outside, on one method, answering your questions.

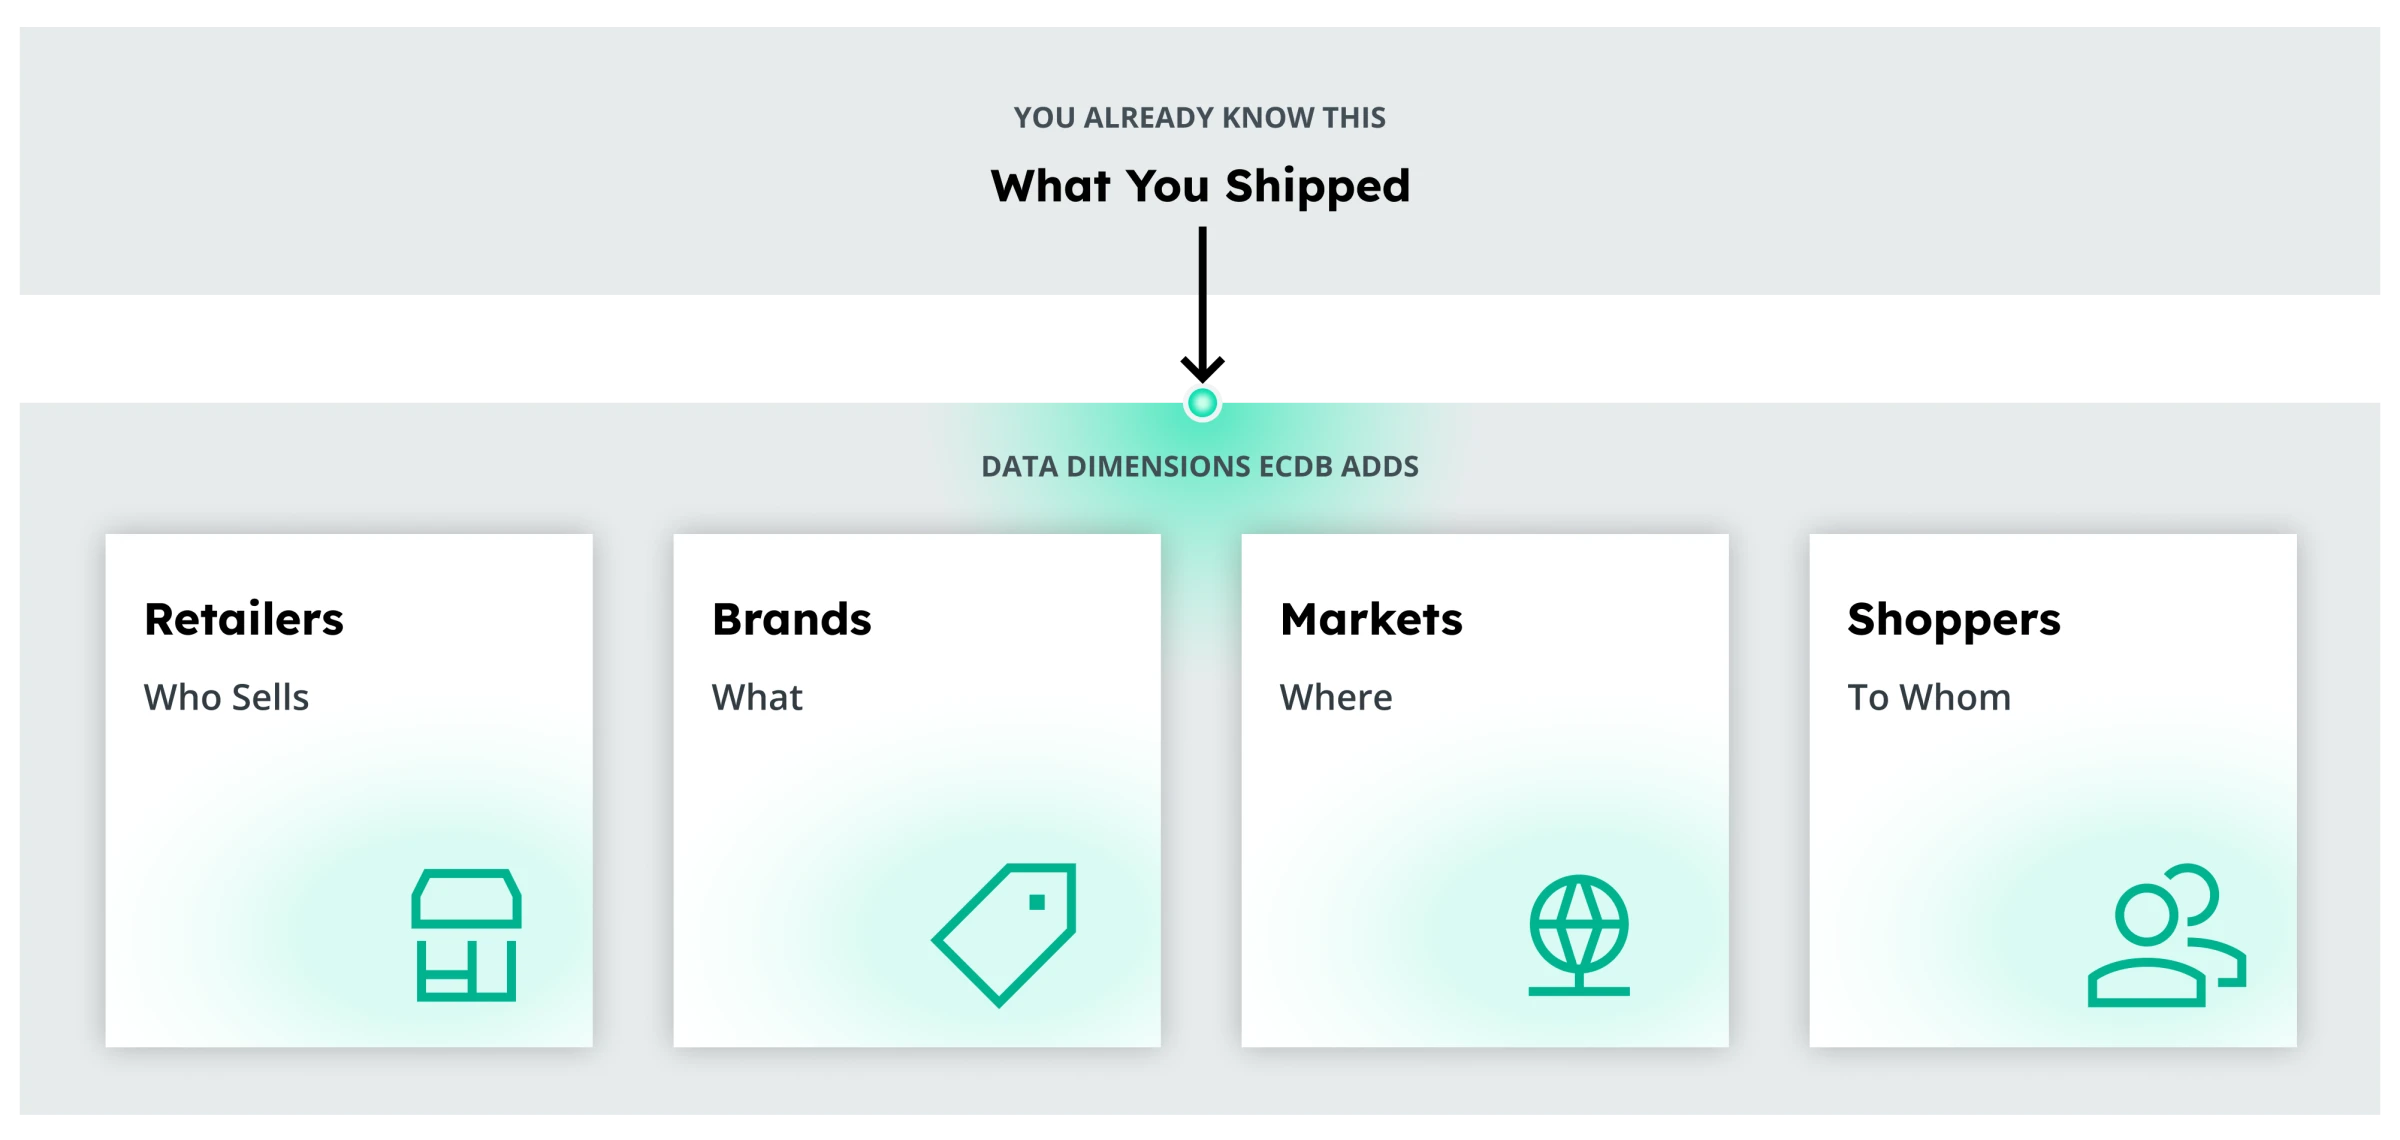
The question you start with, and the data dimensions ECDB adds to answer it

One Method, So the Numbers Reconcile

Market, retailer and buyer figures are produced the same way, so they add up instead of contradicting each other.

Modeled from Outside the Relationship

Every figure is independent of the partner it describes, so you see the whole market, not the parts partners choose to share.

Enter Wherever Your Question Sits

A channel question begins with who sells, a sizing question with where. All is based on one data model, so each answer leads straight to the next question.

Example Use Cases

Start With the Question Closest to Your Job

These are the questions brand teams most often ask. Each one is a worked example on a real market and category, and each one combines two of the four datasets above.

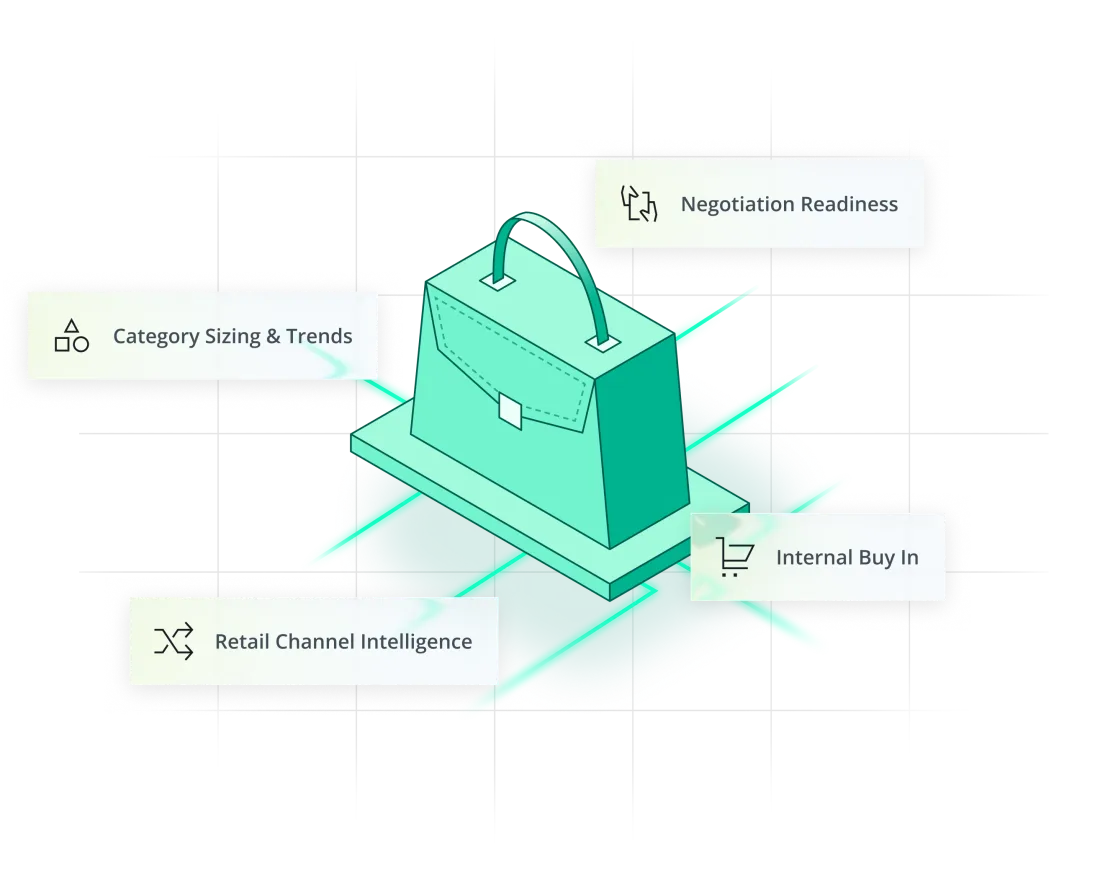
Category Sizing & Trends
Example United Kingdom Food & Beverage

Size Your Category, and See Where It Is Actually Heading.

"How big is my category in this market, and is the trend I am planning against still the current one?"
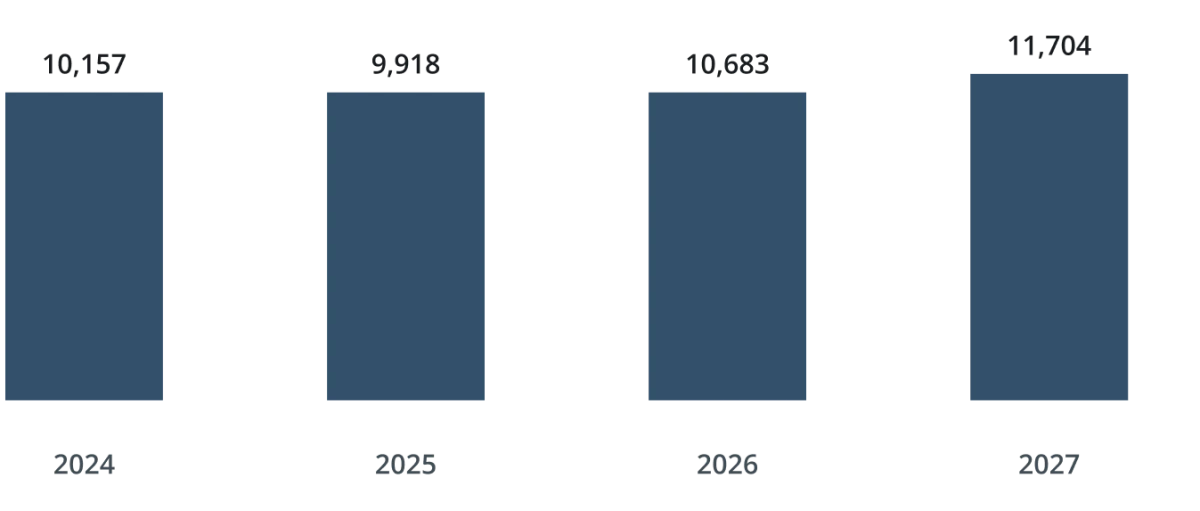
  • The 2025 dip was a correction instead of a turning point. The market fell 2.4% in 2025 and climbed back above its 2024 level in 2026. Planning on the annual figure alone would have meant preparing for a decline the market never followed through on.
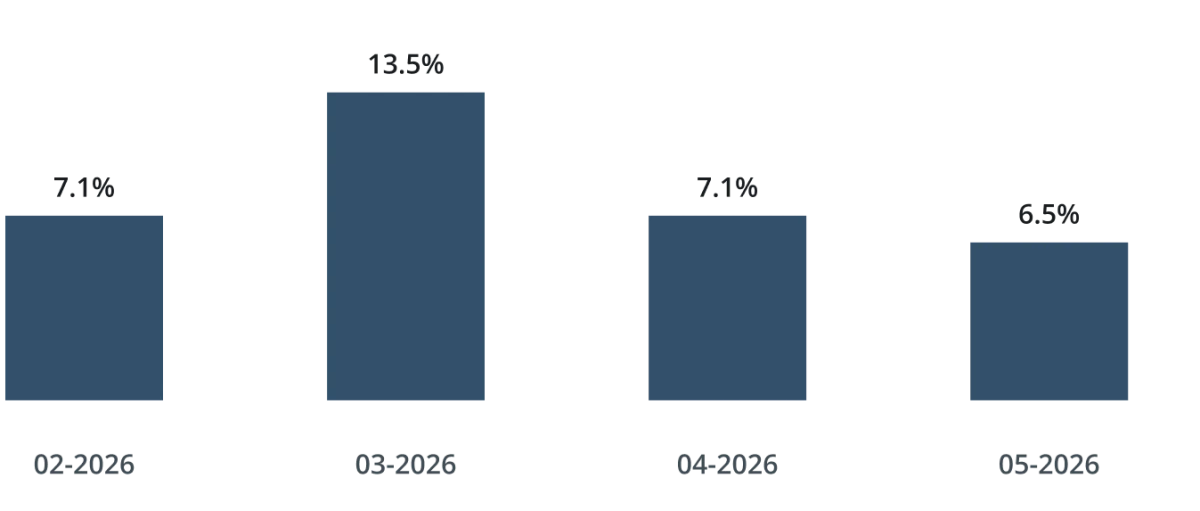
  • Monthly data confirms the recovery as it happens. Every month of 2026 shown grows on the year before, in line with the forecast of around 8% for the full year.
  • Growth is solid and settling. Momentum peaked in March at 13.5% and now runs at around 7%, a steady pace to plan with.
  • The case for more budget holds. The UK online food market adds almost £1.8 billion between 2025 and 2027. Brands that hold back after the dip risk losing share in a market that is already growing again.
Draws On
  • Who SellsRetailers(not used)
  • WhatBrands
  • WhereMarkets
  • To WhomShoppers(not used)

Online Food Revenue, United Kingdom

2024 to 2027 Forecast (in million £)

Bar chart of online food revenue in the United Kingdom from 2024 to 2027

The Monthly View Provides a Real-Time Glimpse

Monthly Market Revenue Growth in 2026

Bar chart of monthly market revenue growth in 2026

Source: ECDB, modeled data. Market revenue for the Food category. Monthly growth compares each month to the same month a year earlier. Monthly figures are revised as new inputs become available. Forecast values are model based estimates and subject to change.

Built for Brands at Companies Like These
  • Nike
  • Red Bull
  • L'Oréal
  • Nutella
  • adidas
  • Samsung
  • Bosch
  • STIHL
Success Stories

Same Job. Same Reporting Line. Same Problem.

Three brand teams describing what changed once market data came from one consistent source instead of manual research.

Enterprise Retail & E-Commerce Group

DACH & Europe

Monthly data with year-over-year comparison helps us understand the market quickly, not weeks later.

Head of Insights, E-Commerce Retail
Before
Sources refreshed too slowly for a short reporting cycle, and business units kept asking the same questions separately.
What Changed
Monthly GMV with year-over-year context and first- and third-party splits, as one reference for the whole group.
Result
A recurring competitive readout became a standing internal format.

Global Footwear & Apparel Group

Europe

Our subsidiaries said there were no more potential customers. So we showed them the ranking and asked: what about these players?

Central E-Commerce Team
Before
Monthly reporting had no external benchmark and centered on one home market.
What Changed
Market sizing by country and footwear category, built into the monthly deck across Europe.
Result
A repeatable monthly narrative, later reused to check carriers per market.

Global Consumer Electronics Group

Global

Right now we mostly find information by searching online. We need a more complete view by country, category, and marketplace.

Head of Market Insights
Before
Market data was assembled by hand, and revenue, GMV and net sales were used interchangeably.
What Changed
One framework separating market revenue from retailer GMV, with exportable tables.
Result
Shared definitions made the numbers usable in front of leadership.

Bring Your Own Category to the Demo.

Tell us the category and the markets you plan for. We will run these views on your data in the meeting, not as a follow-up.

Book a Demo

Frequently Asked Questions

Ready to Unlock the Full Power of ECDB?

Book a demo to see how ECDB's market intelligence can support your business.