How to Prepare for Seasonality in E-Commerce
Seasonality is th predictable rise and fall in demand over the course of a year. Here is how it influences decision-making in e-commerce.

Article in a Nutshell:
US e-commerce revenue swings by 48% between its lowest month and its highest, from US$77.1 billion in February to US$113.9 billion in December.
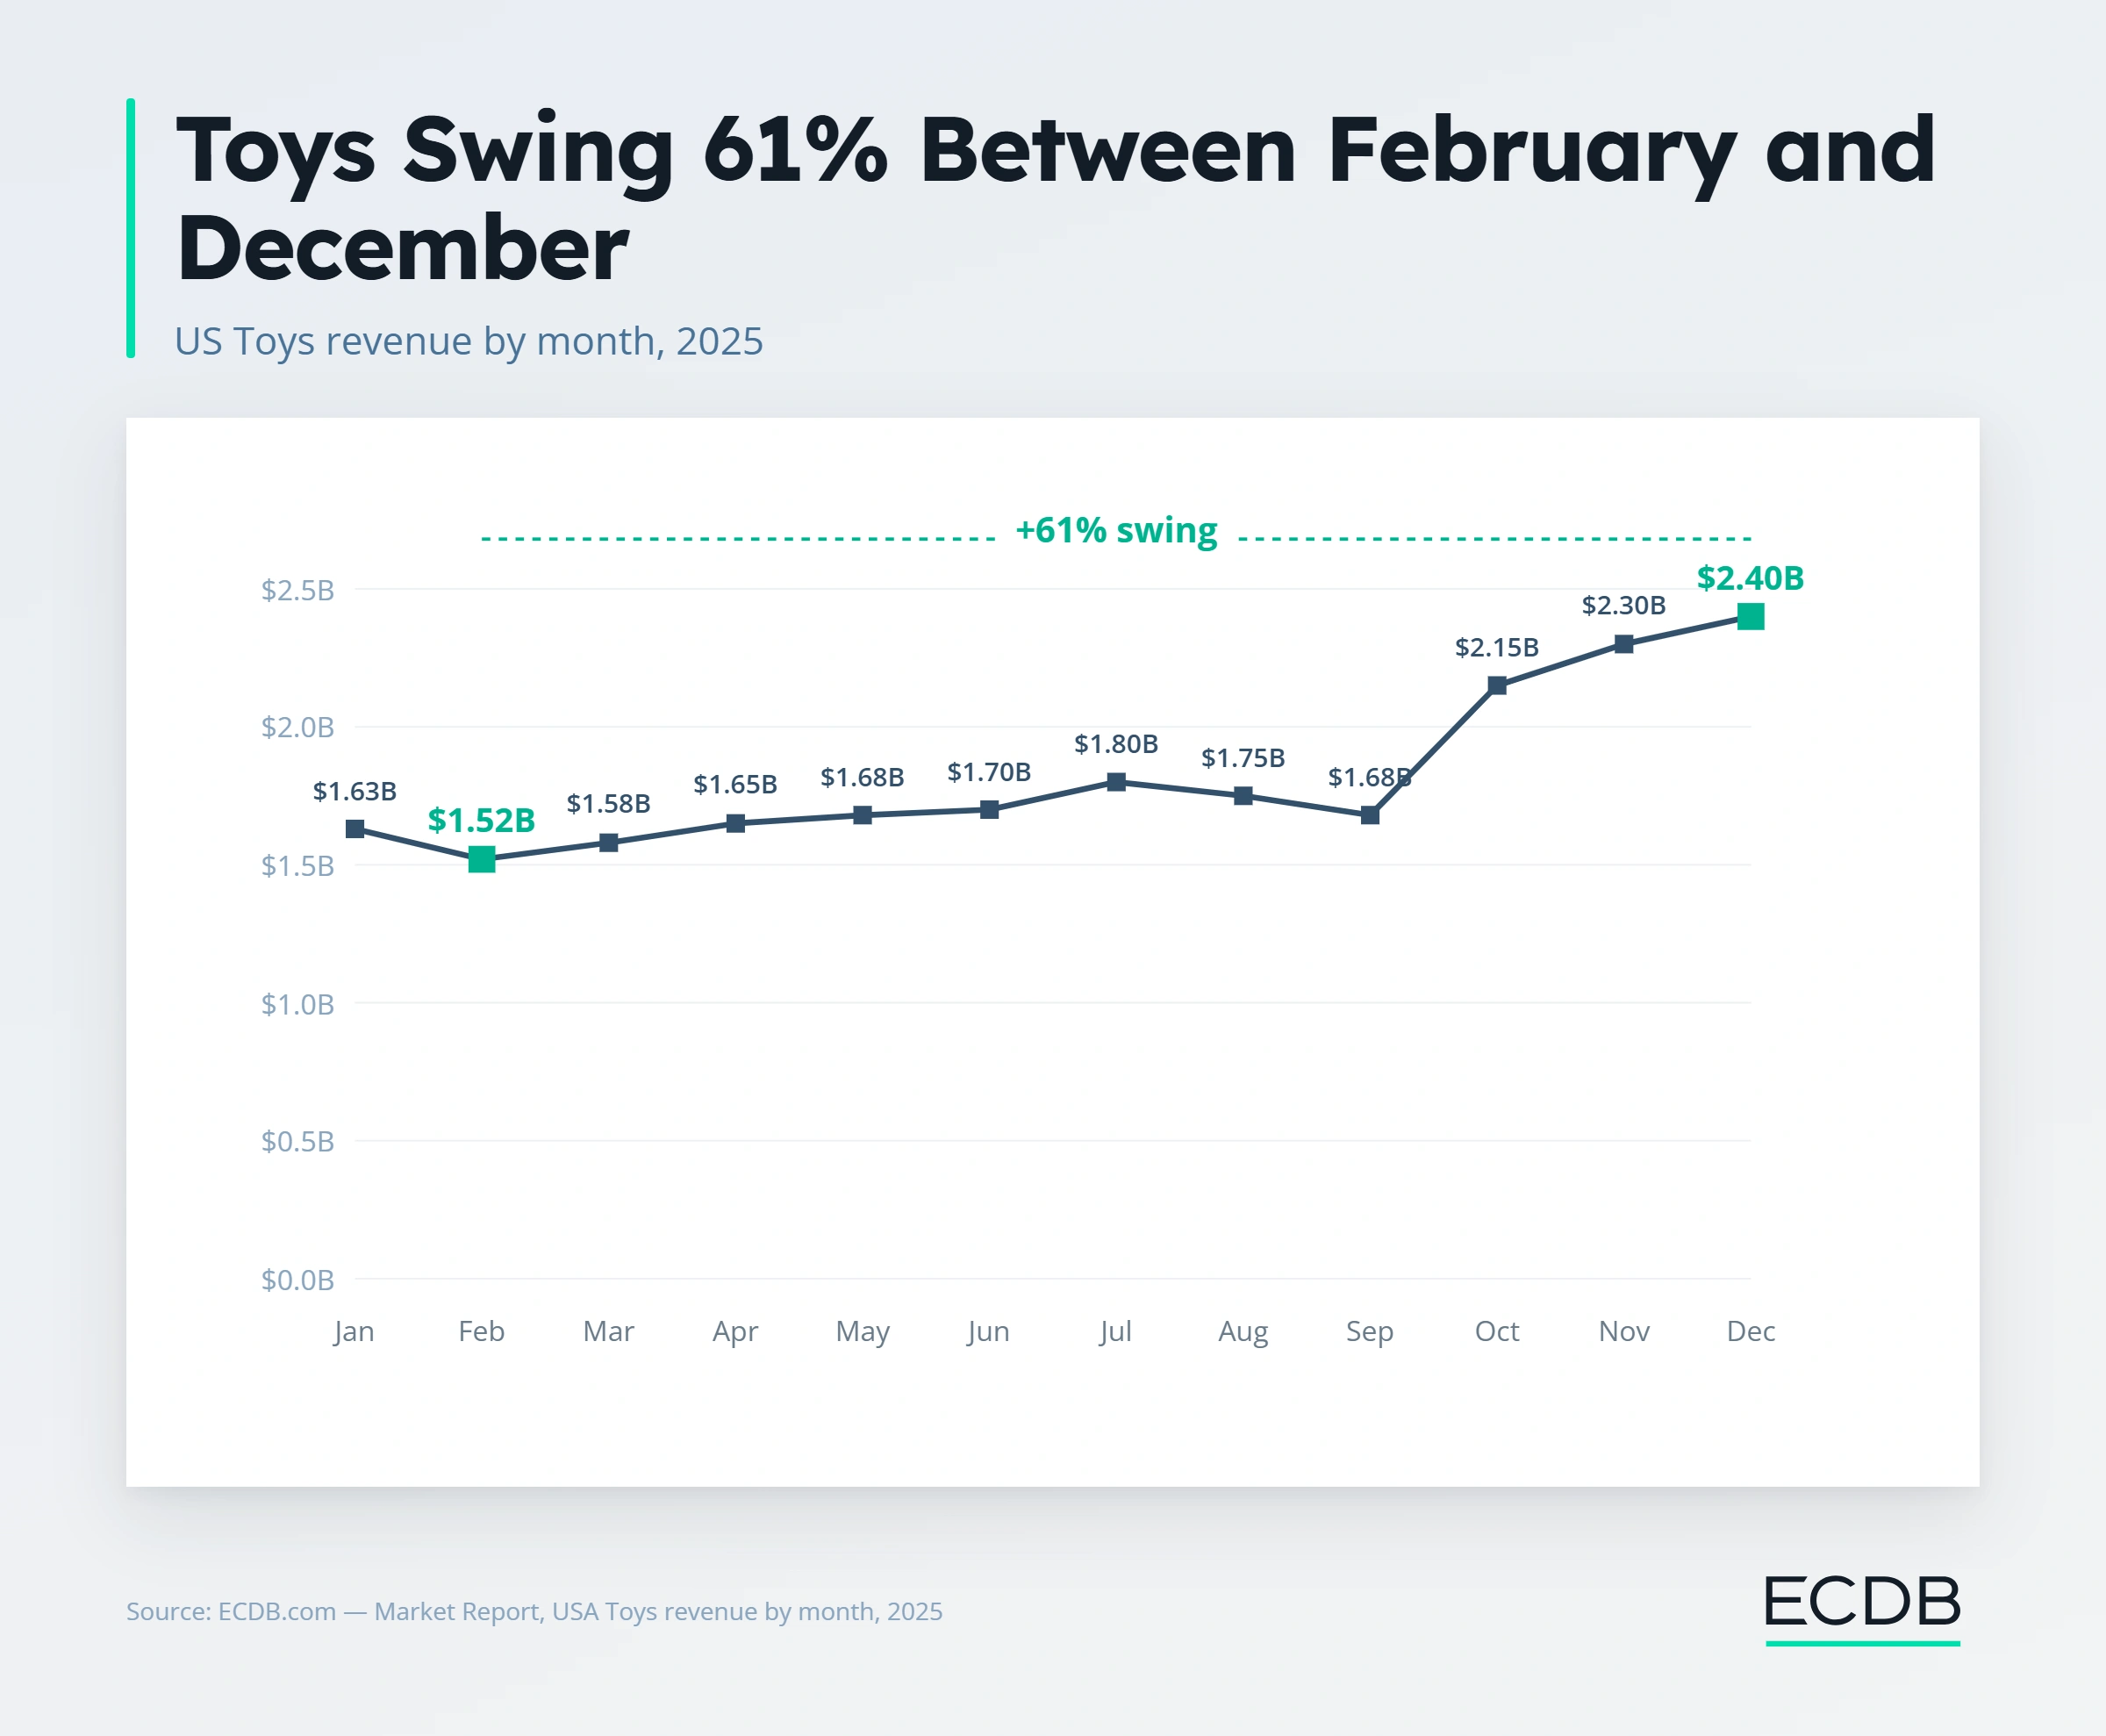
Toys swing even harder than the overall market, 61% between February and December, exactly what a gift-driven category should look like.
Garden products don't follow the holiday calendar at all. They peak in May and barely move in December, on a completely different cycle tied to planting season.
Seasonality is the predictable rise and fall in demand a category sees over the course of a year, tied to holidays, weather, or whatever rhythm actually governs when a product gets bought and used.
How do you prepare for it? By finding out what your own category's calendar looks like first, because "stock up for the holidays" can mean something different for each industry.
What Seasonality Actually Looks Like in the Data
US e-commerce revenue isn't flat across the year, and the swing is bigger than a lot of planning accounts for. Revenue dipped to US$77.1 billion in February 2025, its lowest point of the year, then climbed steadily through spring and summer before jumping sharply in the last quarter: US$100.6 billion in October, US$110.4 billion in November, US$113.9 billion in December.
That's a 48% gap between the slowest and busiest month, all inside the same calendar year.
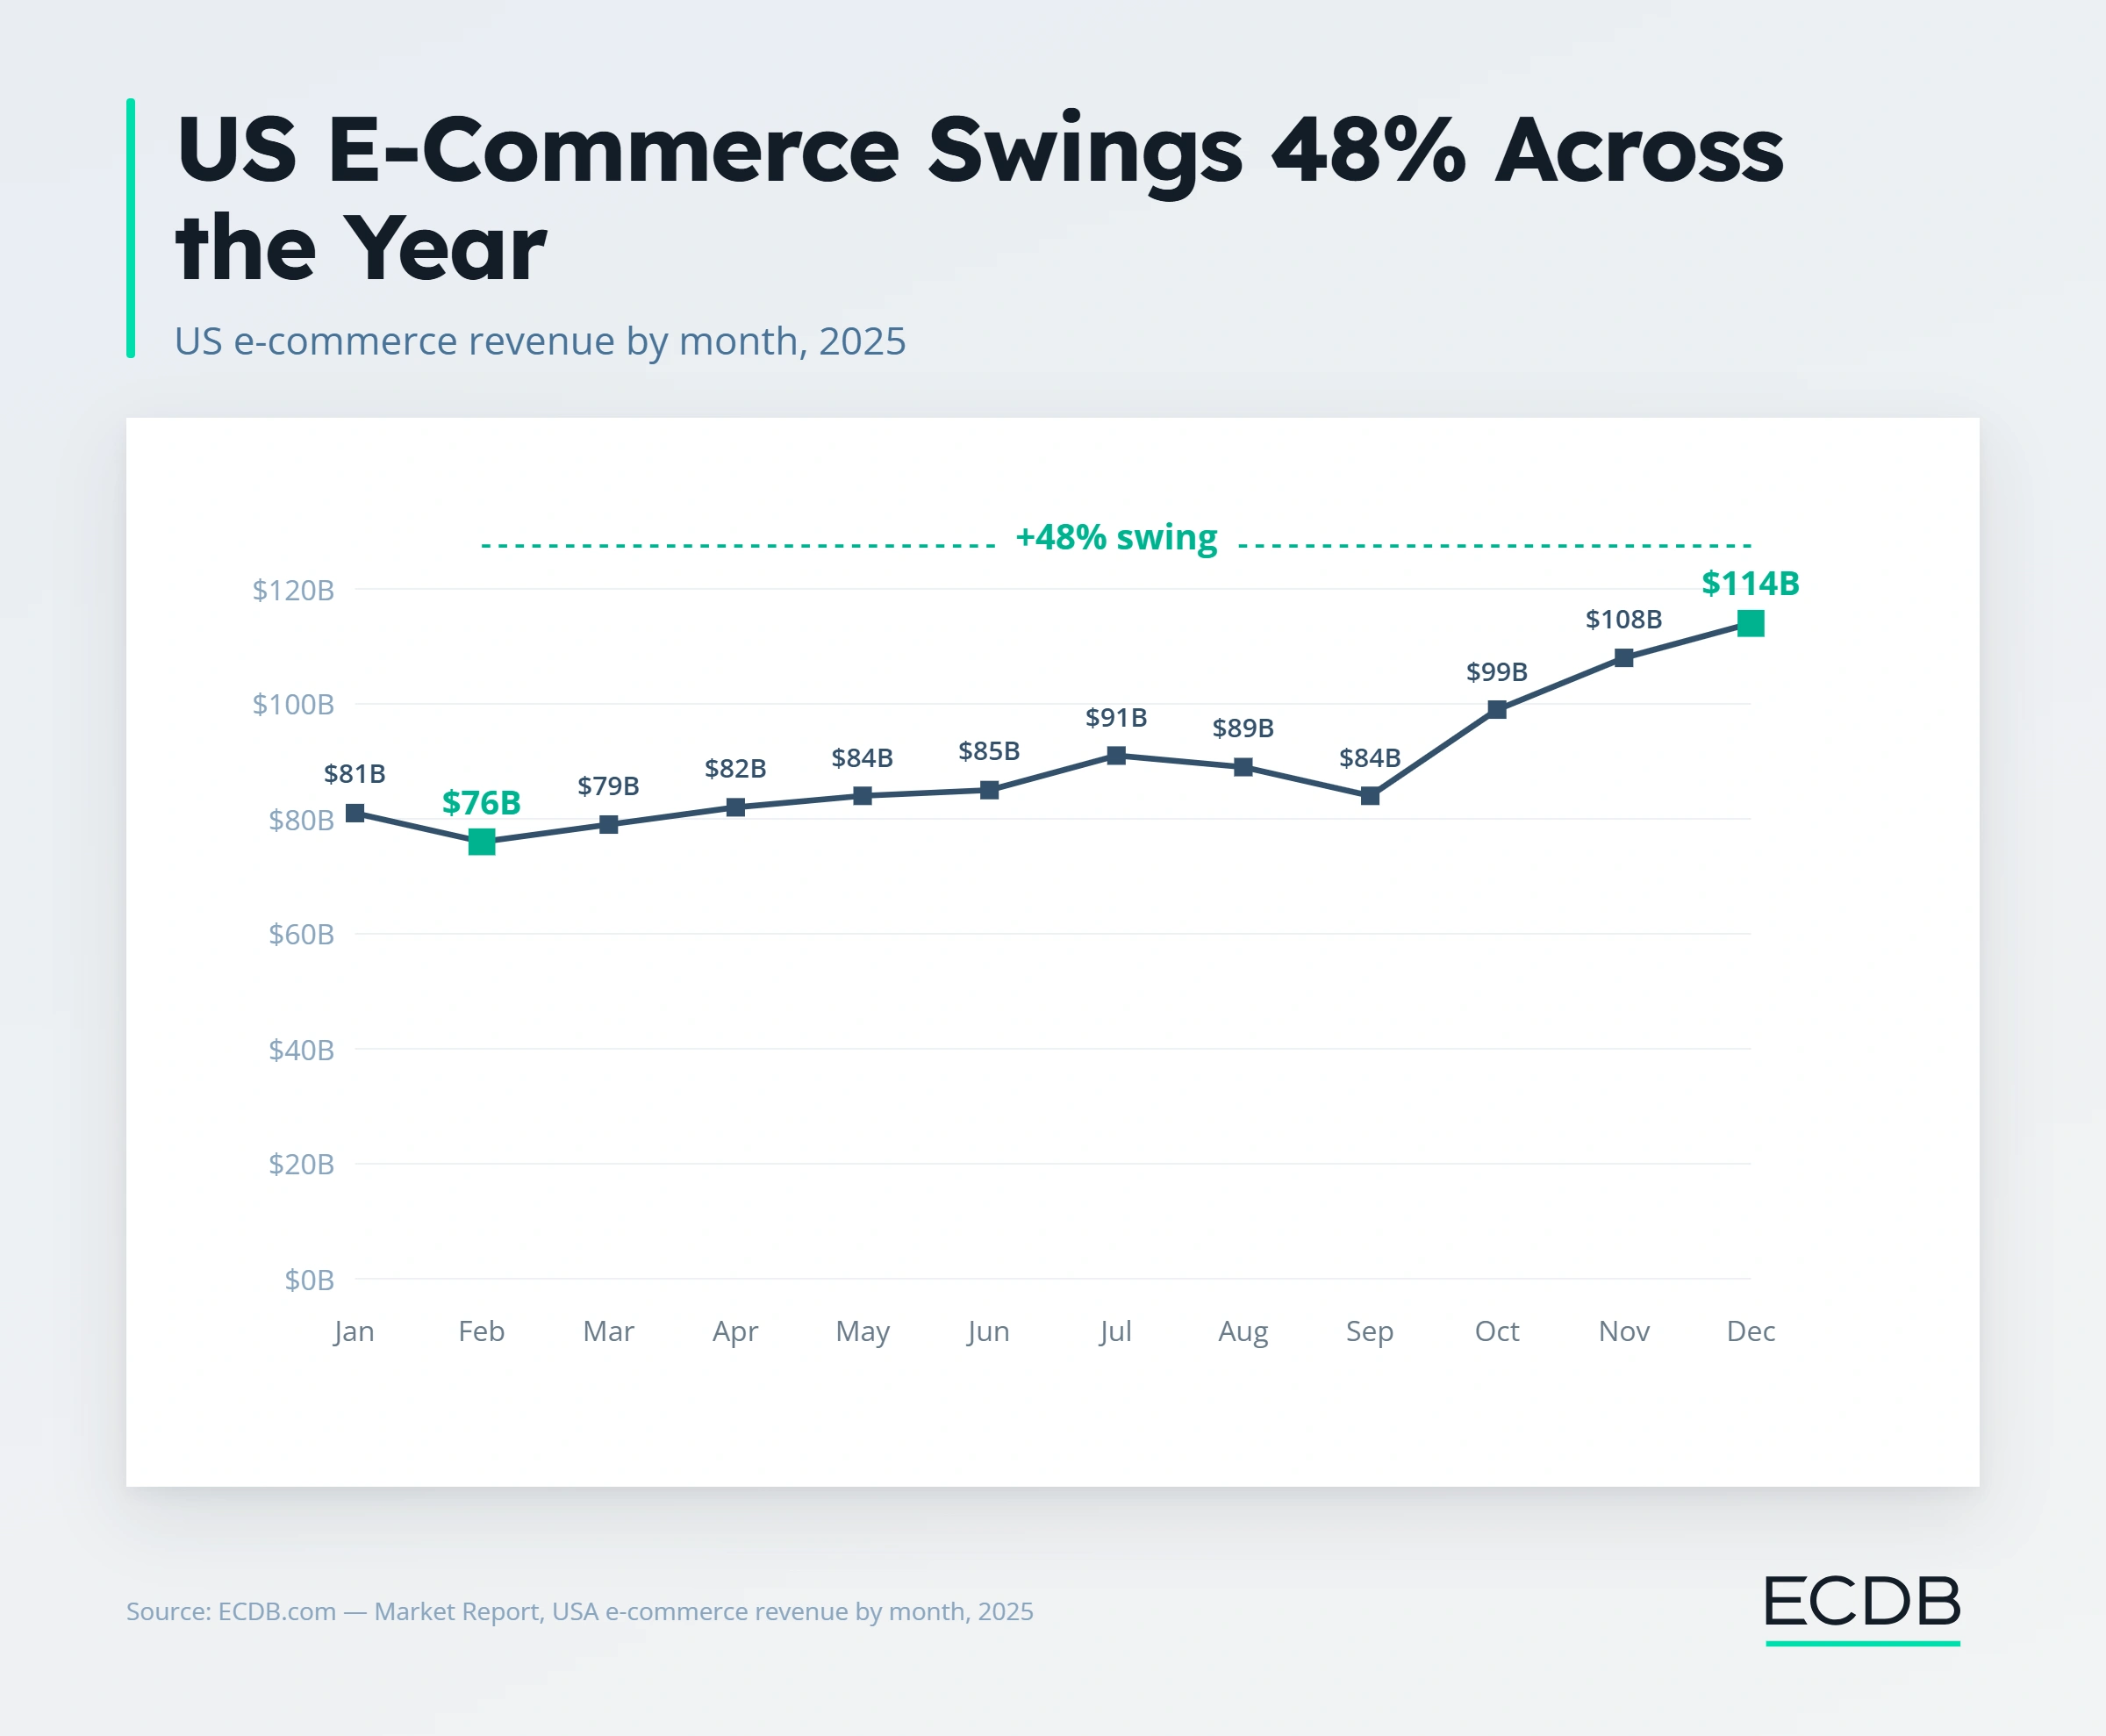
That overall curve is useful context, but it hides more than it reveals. It's an average of dozens of categories with completely different rhythms, some of which barely resemble the holiday shape at all.
Not Every Category Peaks in December
Toys follow the holiday calendar even more sharply than the market average. Revenue climbs from US$1.49 billion in February to US$2.40 billion in December, a 61% swing, exactly what a gift-driven category should look like: a slow first half of the year building toward a final-quarter surge.
Household Care tells a more surprising story. Nobody plans a gift list around dish soap, and yet the category swings from US$729 million in February to US$1.09 billion in December, a 49% jump, almost identical to the broader market's swing. Some of that is genuine holiday demand, cleaning supplies and hosting essentials ahead of gatherings, and some of it is just riding the same broader wave of fourth-quarter shopping activity that lifts nearly everything.
Garden breaks the pattern entirely. It peaks in May at US$1.82 billion, tied to planting season, and its December figure, US$1.68 billion, is barely a bump above its autumn numbers.
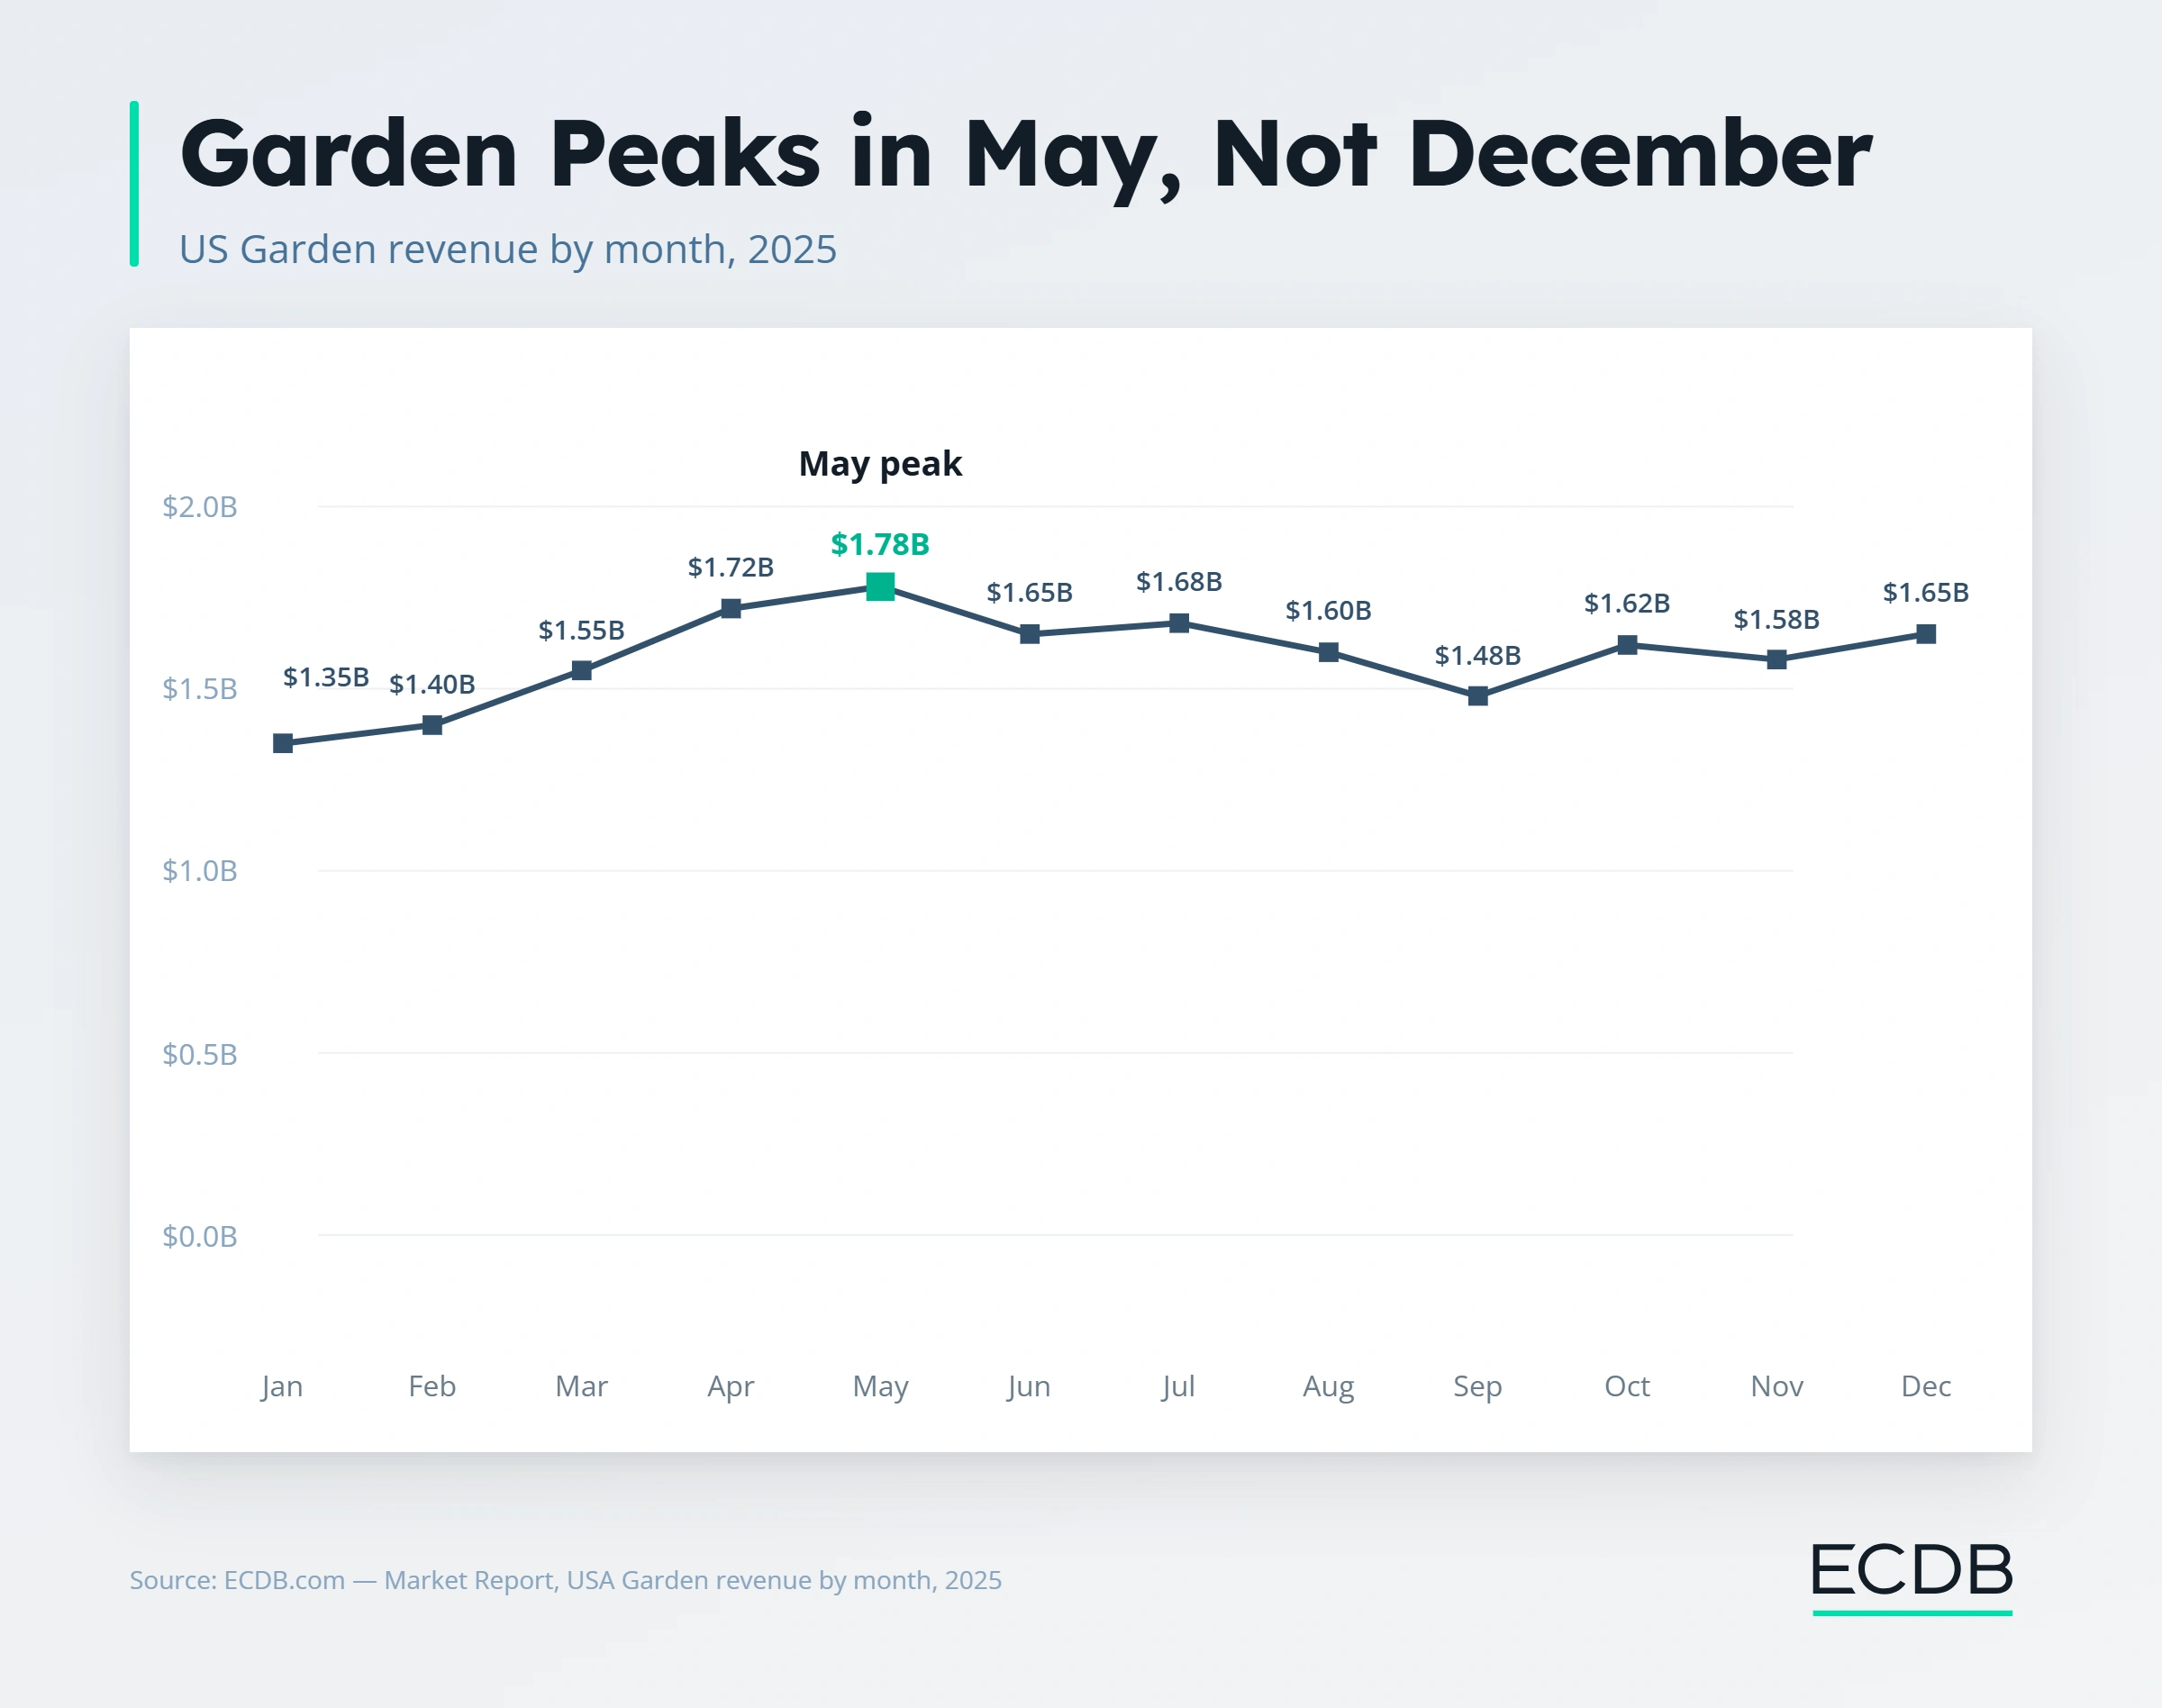
Its actual low point is January, not the summer lull most other categories don't have. A garden retailer planning inventory and staffing around "the holidays" is preparing for the wrong season altogether.
Why This Matters Beyond the Numbers
A seasonal curve is a preview of everything downstream of revenue, not just a revenue chart on its own.
Seasonality impacts e-commerce decision-making in the following ways:
how much inventory to hold and when,
how far in advance to place supplier orders,
when to staff up customer service and fulfillment,
when marketing spend actually earns its keep, versus
when it's competing against every other retailer bidding up the same ad auctions.
Getting the timing wrong in either direction is expensive. Building inventory for a December surge that a category doesn't actually have ties up cash that could have funded the month that matters.
Missing the real surge means running out of stock exactly when demand peaks, or paying premium rush shipping to catch up. A garden retailer would make these mistakes if focusing on December instead of April and May.
How to Actually Prepare
Four checks separate a seasonal plan built on real data from one built on assumption:
Pull the actual monthly curve for the specific category, not the generic retail calendar. A toy retailer and a garden retailer are effectively running two different businesses on two different clocks, even if both call themselves seasonal.
Time inventory and cash flow buffers to when the category's own curve actually turns, which can be months earlier or later than "the holidays," not to a date pulled from a general retail calendar.
Ramp marketing spend ahead of the curve's rise rather than at its peak, since waiting until the peak month means bidding against every competitor doing the same thing at the most expensive possible moment.
Treat the off-season as a different job, not a slow version of the same one. A garden retailer's winter is planning and clearance, not a stretch of the same holiday push everyone else is running.
None of these checks work off a guess about what "seasonal" means for a category. They work off the category's own numbers.
How ECDB Helps You Prepare for Seasonality
Every figure in this article, at the monthly level, by category and by country, comes from data ECDB tracks across more than 18,000 categories. That's what makes it possible to build a seasonal calendar around a specific category's actual pattern instead of a generic assumption borrowed from retail in general.
You don't have to guess at your category's calendar. ECDB tracks monthly revenue across more than 18,000 categories and by country, which means you can pull your own category's actual curve, its peak month, its trough month, and the size of the swing between them, before a single inventory or budget decision gets made.
That data is available through ECDB's Analyze & Compare and Profiles tools, so your next seasonal plan can be built around your category's real pattern instead of a calendar borrowed from retail in general.
Related Articles
All ArticlesReady to Unlock the Full Power of ECDB?
Book a demo to see how ECDB's market intelligence can support your business.