Electronics Is the Biggest E-Commerce Category in the US. Meet the Top Retailers Behind It.
Electronics is not just consumer tech, as the top 100 retailers in the US market show. Here is who's behind the United States' largest category.
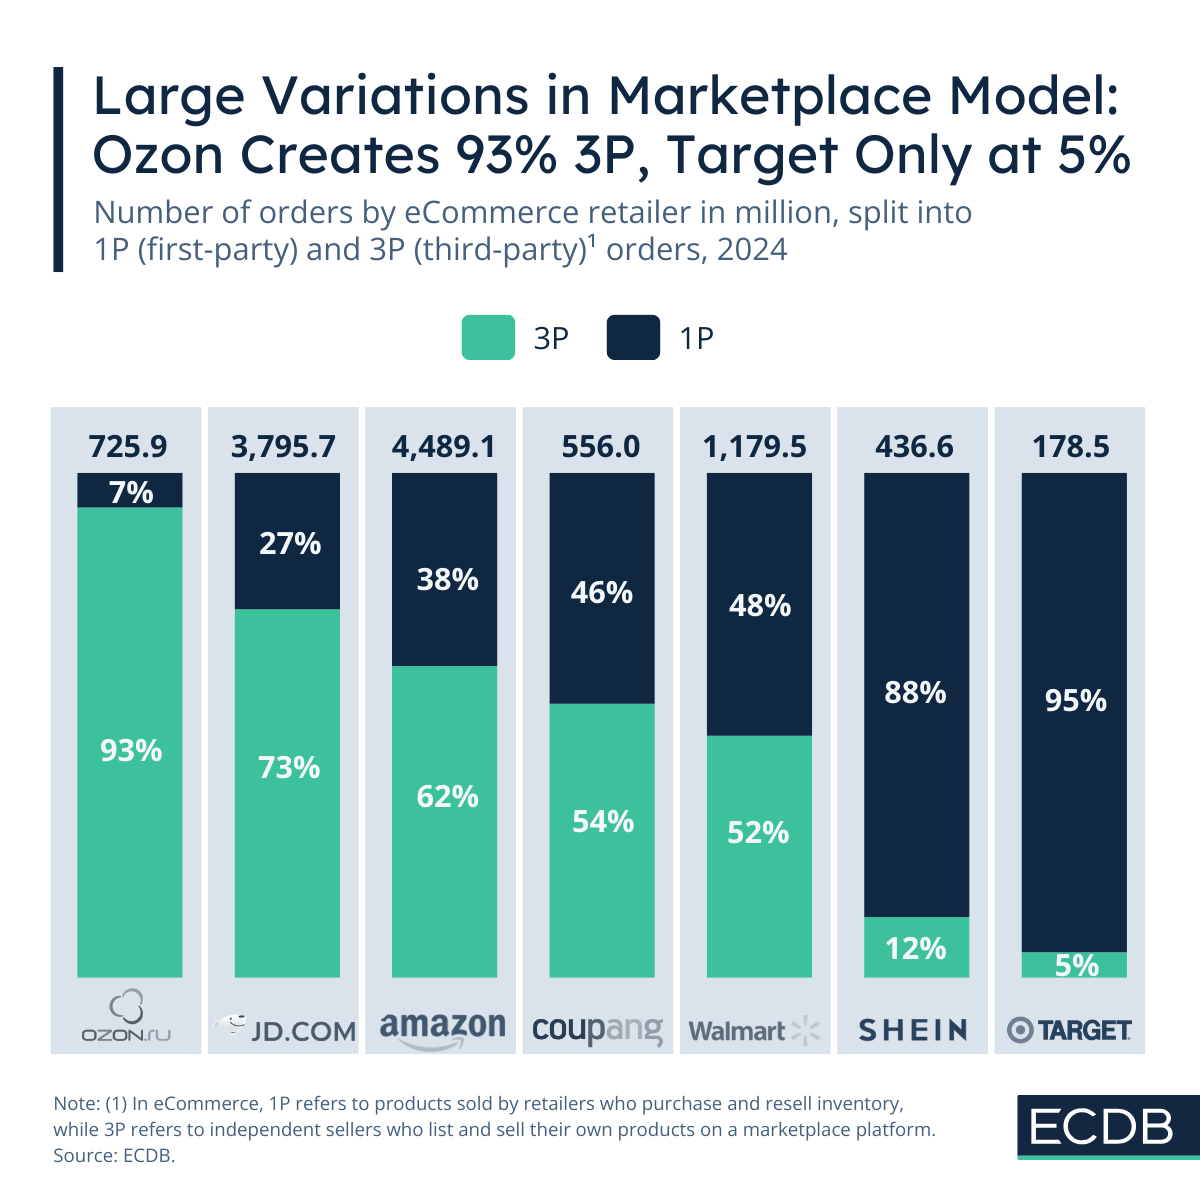
Number of Orders on ECDB Retailer Profiles
Ozon.ru and JD.com have a higher share of 3P orders, as opposed to shein.com and target.com, whose orders lean towards 1P.

Nadine Koutsou-Wehling
Data Journalist
May 27, 2025
Retailers
1P (first-party) and 3P (third-party) orders are paramount to understanding eCommerce retailer operations in closer detail. The distinction is widely used, but it needs an initial clarification.
In eCommerce, 1P orders refer to products owned by the marketplace, either through in-house production or wholesale purchase. In contrast, 3P orders involve products owned by independent sellers who use the platform to reach customers and typically pay listing and advertising fees.
You can now find the number of orders including the respective 1P and 3P orders in the ECDB Tool’s Retailer Profiles under the section Transaction KPIs. The number of orders view including the 3P and 1P share is now available for your analysis.
In the following we show how you can interpret the data, with some of the leading retailers in worldwide eCommerce and their 1P vs 3P mix.
Taking some of the globally leading hybrid marketplaces as examples, here is what the distribution of 1P and 3P orders looks like.
In general, one can surmise that North American and European companies rely more on 1P orders, while Asian and Latin American businesses rely more on 3P orders.
Ozon.ru is an example of a hybrid marketplace made up largely (93%) of 3P orders. Of the selected stores depicted, JD.com follows with a 3P share of 73%, compared to 27% 1P orders, meaning orders sold from JD.com's own inventory.
These shares align with patterns in and around Asian eCommerce, where marketplace models with a high share of 3P orders are common. Operating with a high 3P share has several advantages, including a wider product selection at lower inventory cost and a good income potential due to seller fees and additional services.
Despite regional preferences for the 3P model, there has been a general shift toward the 3P model over the years. This shift is most clearly represented by Amazon and Walmart, the two eCommerce giants in the United States. Their respective 3P order shares have grown over the years, reaching 62% for Amazon and 52% for Walmart in 2024.
Given Amazon’s 2024 figure of almost 4.5 billion orders, it underlines the outstanding importance this eCommerce platform has for third-party sellers. They reach a much wider audience through selling on Amazon.
Nonetheless, this increased reach comes at a cost. To rank higher in search results, sellers must pay listing fees and create notable storefronts and advertisements. Ultimately, Amazon is positioned at the top of the value chain and benefits from the sale either way.
Walmart follows suit with a 3P share of 52%, although its share has fluctuated in the past. As the second-largest U.S. eCommerce platform, Walmart is still well behind Amazon, with 1.2 billion orders in 2024.
Between the two in terms of 3P share, but well behind in the number of orders is Coupang, with 556.0 million orders in 2024. Of those, 54% were 3P. Similar to Amazon, Coupang’s share of 3P orders has increased over the years.
At the other end of the spectrum are marketplaces that focus on 1P orders. This group includes Target and Shein. Both fall into the regional pattern mentioned above in that they primarily operate in Western markets.
Despite their low participation of 3P orders, both Target (5%) and Shein (12%) are on the rise currently. Target’s 3P share has been increasing incrementally, while Shein just opened its marketplace in 2023. Shein’s jump to 12% of 3P orders within a span of two years is suggesting a continuously high growth potential.
The increase of their 3P share confirms the broader pattern that is taking place, which is a shift toward 3P order volumes in eCommerce.

Related Articles
Electronics is not just consumer tech, as the top 100 retailers in the US market show. Here is who's behind the United States' largest category.
In the global top 10 ranking, Amazon holds the number one spot, yet it is still outnumbered. Players like Pinduoduo, Douyin, Taobao and Tmall follow close behind. Together with the others, they account for 80% of this top ranking.
Of the 30 fastest growing marketplaces, 17 have a third-party share of over 80%. This hints at a future of platform ecosystems over inventory-led business models.
Click here for
more relevant insights from
our partner Mastercard.
Book a demo to see how ECDB's market intelligence can support your business.