Younger Consumers Drive Low-Cost E-Commerce Growth: Temu, TikTok and Shein
Temu, TikTok and Shein are known for their low cost and high product variety: Here is proof that they are primarily used by younger shoppers. But exceptions remain.
Retailer Analysis in eCommerce
The first-party (1P) and third-party (3P) model in eCommerce is determined by seller affiliation. Hybrid models include both. Here is how ECDB measures associated revenue.

Nadine Koutsou-Wehling
Data Journalist
July 28, 2025
Other
For years now, eCommerce marketplaces have been growing in popularity. It has therefore become increasingly common for retailers to sell not only their own merchandise, but also offer products by external sellers.
The revenue generated by different seller models on eCommerce retail platforms underlies different calculations. That is why 1P (first-party) net sales and 3P (third-party) GMV cannot usually be compared.
To ensure comparability, ECDB is shifting from a split retailer logic to a more integrated approach. This means that the structure of retailer profiles and rankings is undergoing significant change. Here is what that means in more detail.
There are three types of eCommerce retailer businesses, categorized by how they sell their products and whether they own the products themselves.
Some retailers own and sell all their products directly. Others provide a platform for third-party sellers (often called marketplaces). A third category operates as a mix of both, leaning more toward one model or the other depending on the strategy.
1. The first-party model (1P) describes stores where the retailer sells products directly to consumers and owns the inventory at the time of sale.
It doesn’t matter whether the products are manufactured in-house or sourced from brands or suppliers – what defines the model is the retailer’s ownership and control over pricing, stock, and fulfillment.
Examples of retailers: Ikea, Bestbuy, Apple, Zara
2. The third-party model (3P) includes platform providers that allow external sellers - such as brands or independent merchants - to sell directly to consumers.
The platform itself does not own the inventory but facilitates the transaction by providing infrastructure, advertising tools, and optional services like fulfillment or payment processing.
Examples of retailers: eBay, Temu, Vinted, Etsy
3. Hybrid businesses (1P&3P) drive a combination of the former two models. They sell their own products while also allowing external sellers to list and sell through the same platform.
This setup enables a mix of direct sales and marketplace activity, with the retailer taking on different roles depending on the product or seller.
Examples of retailers: Amazon, Walmart, MercadoLibre
This distinction has been at the basis of ECDB retailer profiles and the rankings, which is why there was the division into Store, Marketplace and Company.
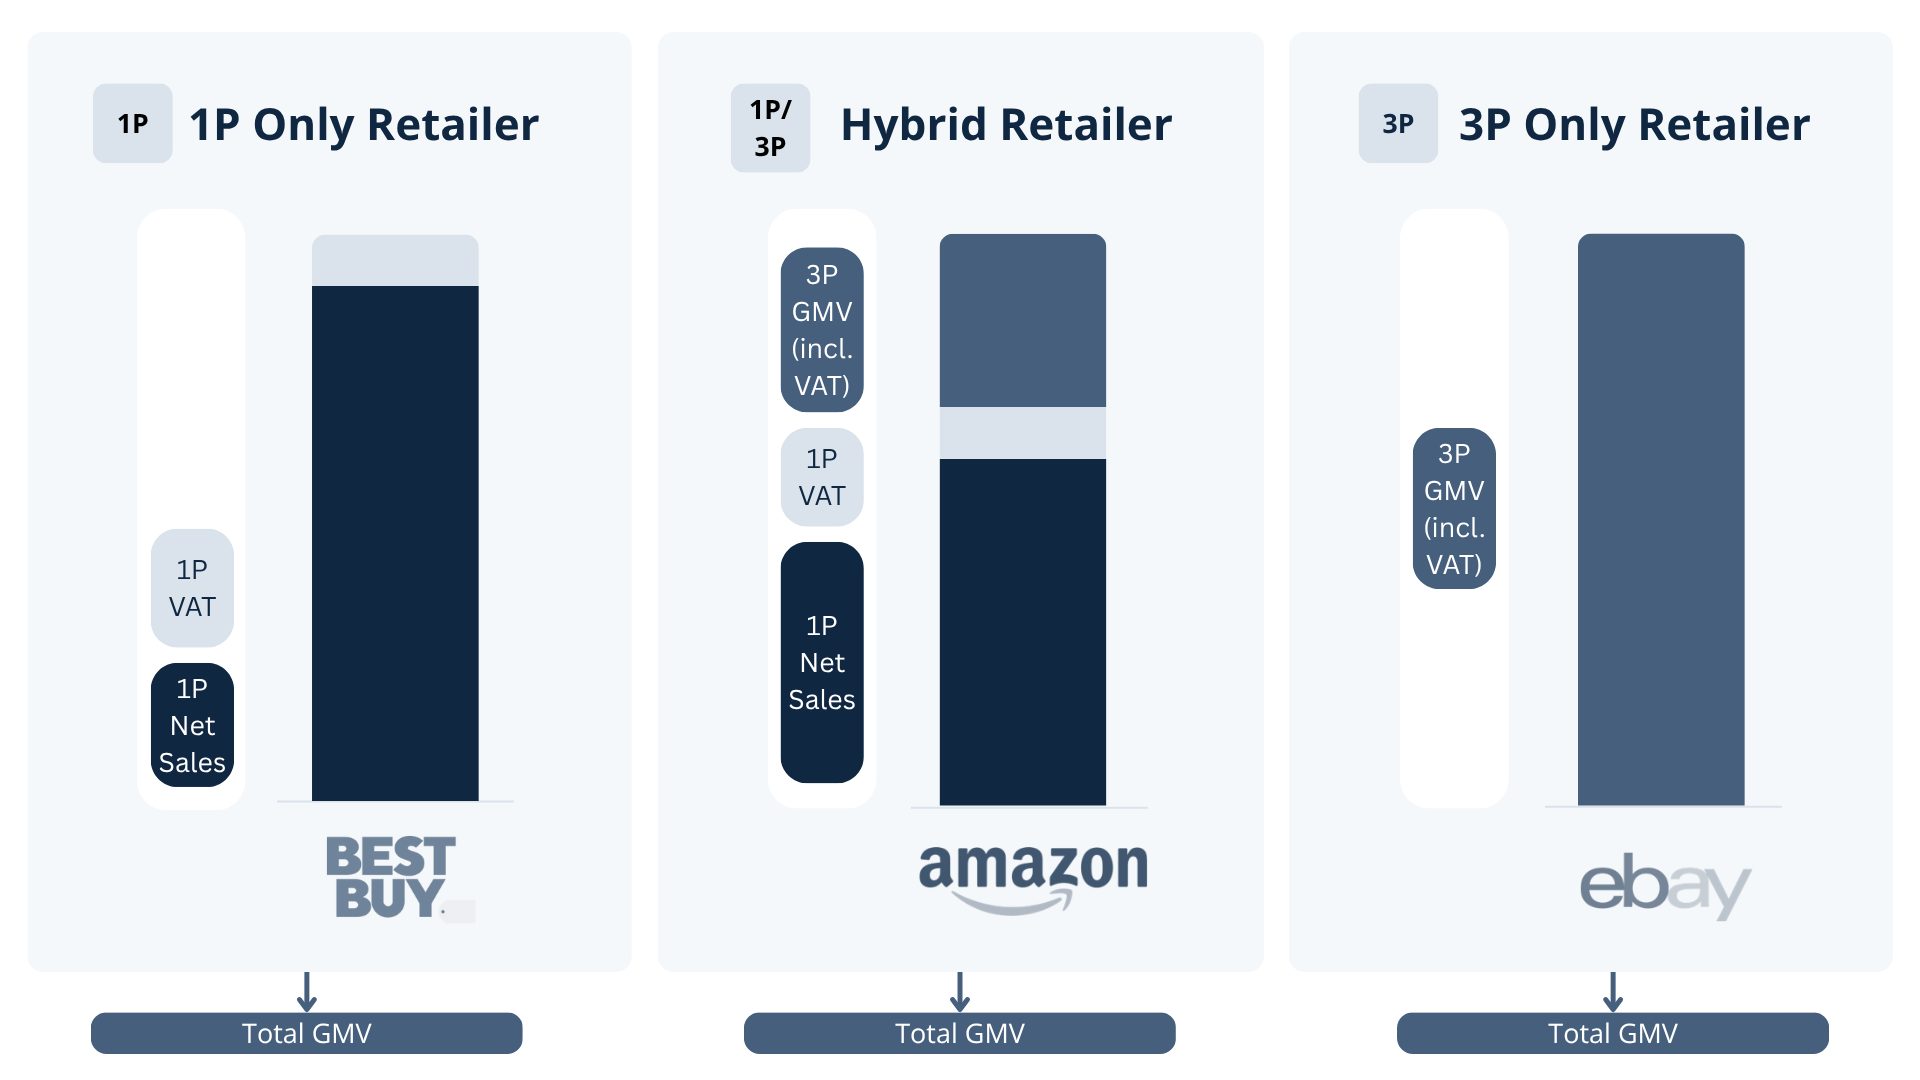
The point where the online store model becomes particularly significant is the measurement of revenue. 3P models always measure revenue in GMV or gross merchandise value. That means a retailer like eBay calculates and reports revenue in GMV, not net sales.
Net sales denote revenue that has been made on a 1P platform where retailers sell their own inventory. Stores like Apple and Zara identify and report revenue as net sales, which is not a volume indicator such as GMV.
Comparing or adding GMV and net sales is like comparing apples and oranges. But to ensure a comparison between retailers with varying business models such as Apple (1P) and eBay (3P), one needs a key figure that underlies the same definition.
For this reason, ECDB uses the Total GMV, which ensures comparability between net sales and GMV. In this way, we can accurately compare online stores, marketplaces and hybrid marketplaces.
Net sales are much closer to what an online retailer gets from selling products. But net sales do not include VAT. GMV is a cumulative indicator of the revenue that was generated on a platform by all sellers, which includes VAT.
As a result, to make net sales comparable to GMV, the Total GMV adds VAT to net sales.
The matter becomes even more intricate when dealing with hybrid businesses that combine 1P and 3P sales. There the measurement becomes more difficult, as two different types of revenue are combined that are calculated differently.
The Total GMV of hybrid marketplaces adds net sales and VAT to GMV. In combination, the resulting figure is now comparable to the other ones.
Naturally, revenue differences hamper comparability between platforms with varying business approaches. ECDB is now addressing the issue with the restructuring of retailer profiles and rankings into a unified scheme.
The new retailer logic at ECDB provides the biggest advantage of comparability. First of all, there is the addition of VAT to the net sales figure to result in Total GMV.
This provides a more equal comparison of revenues than before, where a non-VAT figure (net sales) was compared to one including VAT (GMV).
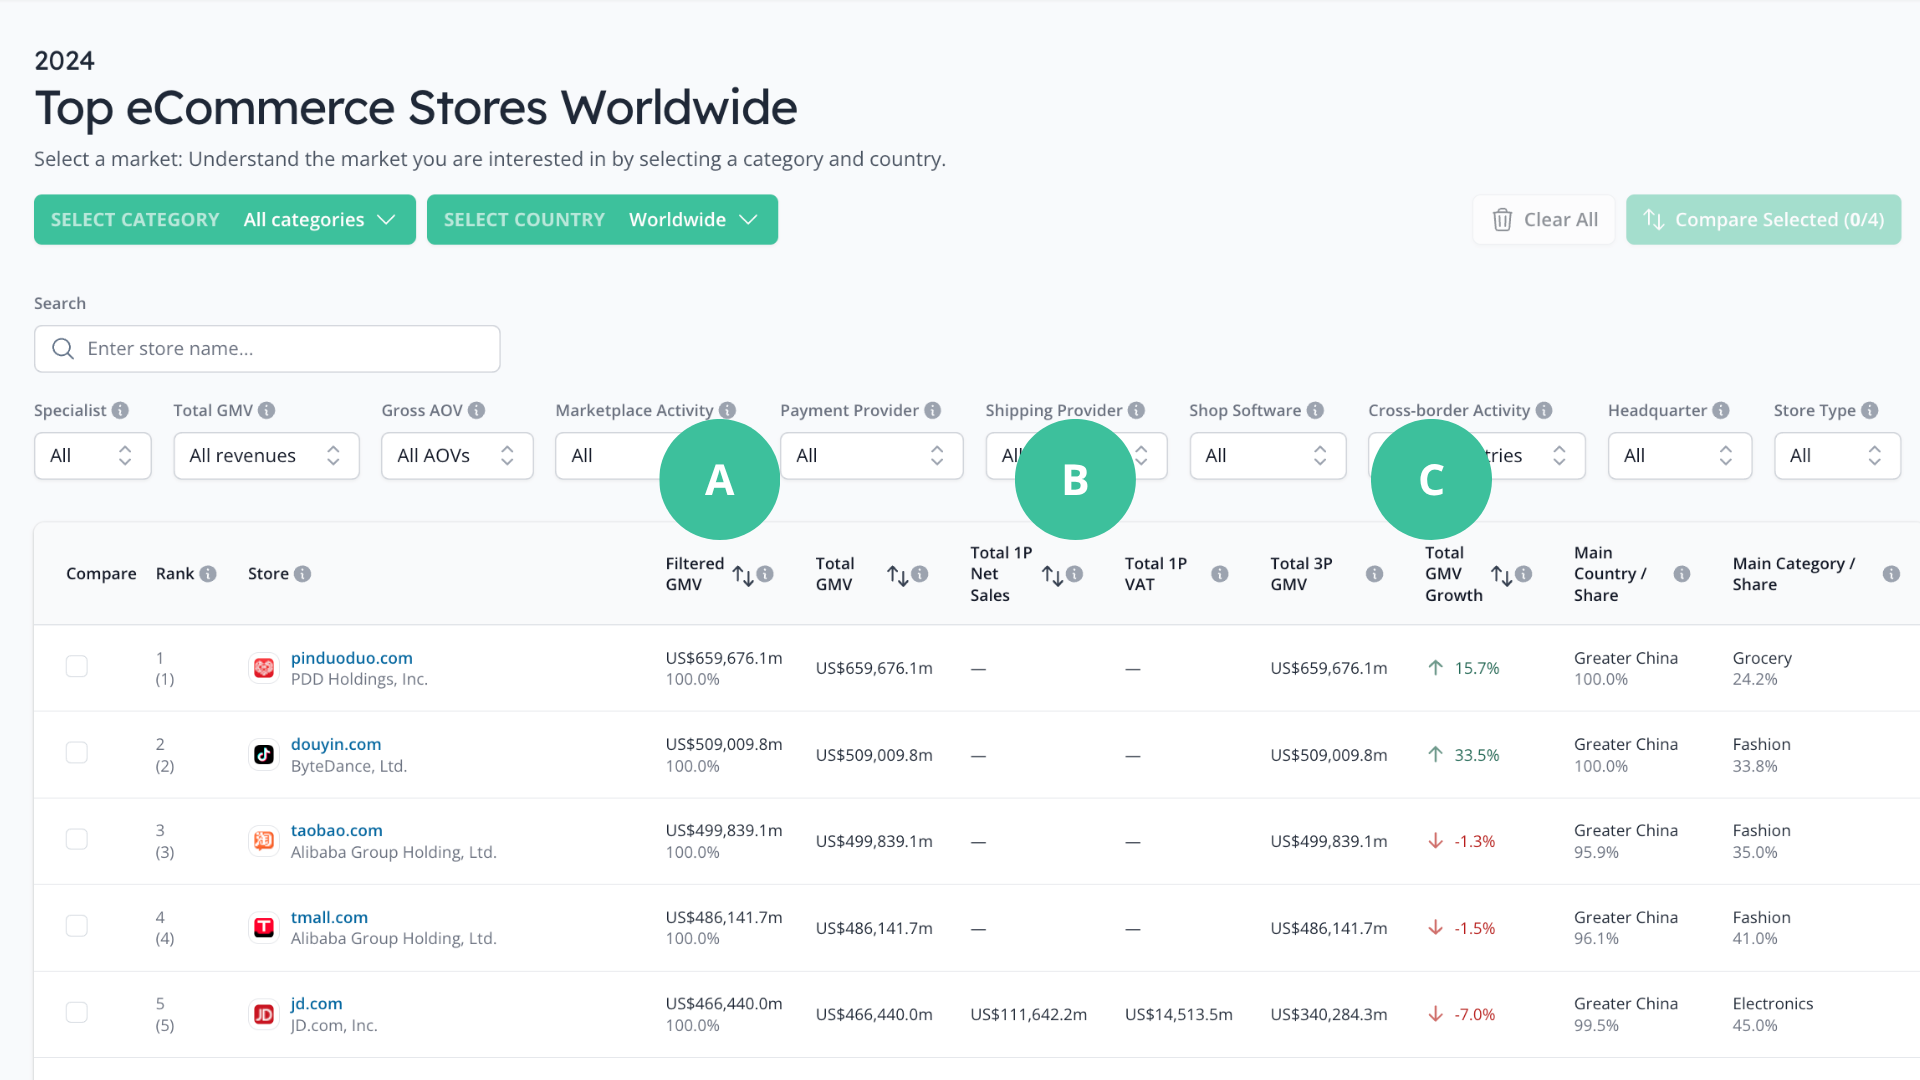
The new ECDB Retailer Ranking now includes all players of various business types.
Whereas before a comparison between a pure 1P player like Ikea and a 3P player like Temu would have been erroneous due to the different revenue definitions, it is now possible to compare the two with the new logic.
A. shows the Total GMV – it is the universally comparable number of revenues between all business types.
B. displays 1P Net Sales and 1P VAT. This includes the revenue generated from the sale of their own-branded products.
C. indicates 3P GMV, which includes the gross merchandise value of products sold on a platform through external sellers.
The distinction facilitates a correct comparison between retailers with a different model. It is also much more straightforward to take a hold of market realities.
Online shoppers do not make a distinction between business models, they visit websites to browse products and buy some of them. Therefore, the competition between Stores, Marketplaces and Hybrid Marketplaces is real and should be displayed as such.
Of course, there is still the possibility to filter the Retailer Ranking for different business approaches and revenue types. This enables a comparison of eCommerce platforms according to individual research needs.
A unified retailer logic also impacts Retailer Profiles. The revenue breakdown on these profiles is now aligned with the new structure. This allows for a consistent ranking and clearer insights, as well as comparability between retailers of a different logic.
As described previously, net sales and GMV cannot be correctly compared due to the varying inclusion of VAT in the figures. Now, it is possible to have an updated view of Total GMV (including 1P net sales + 1P VAT and 3P GMV) as well as one of the single components.
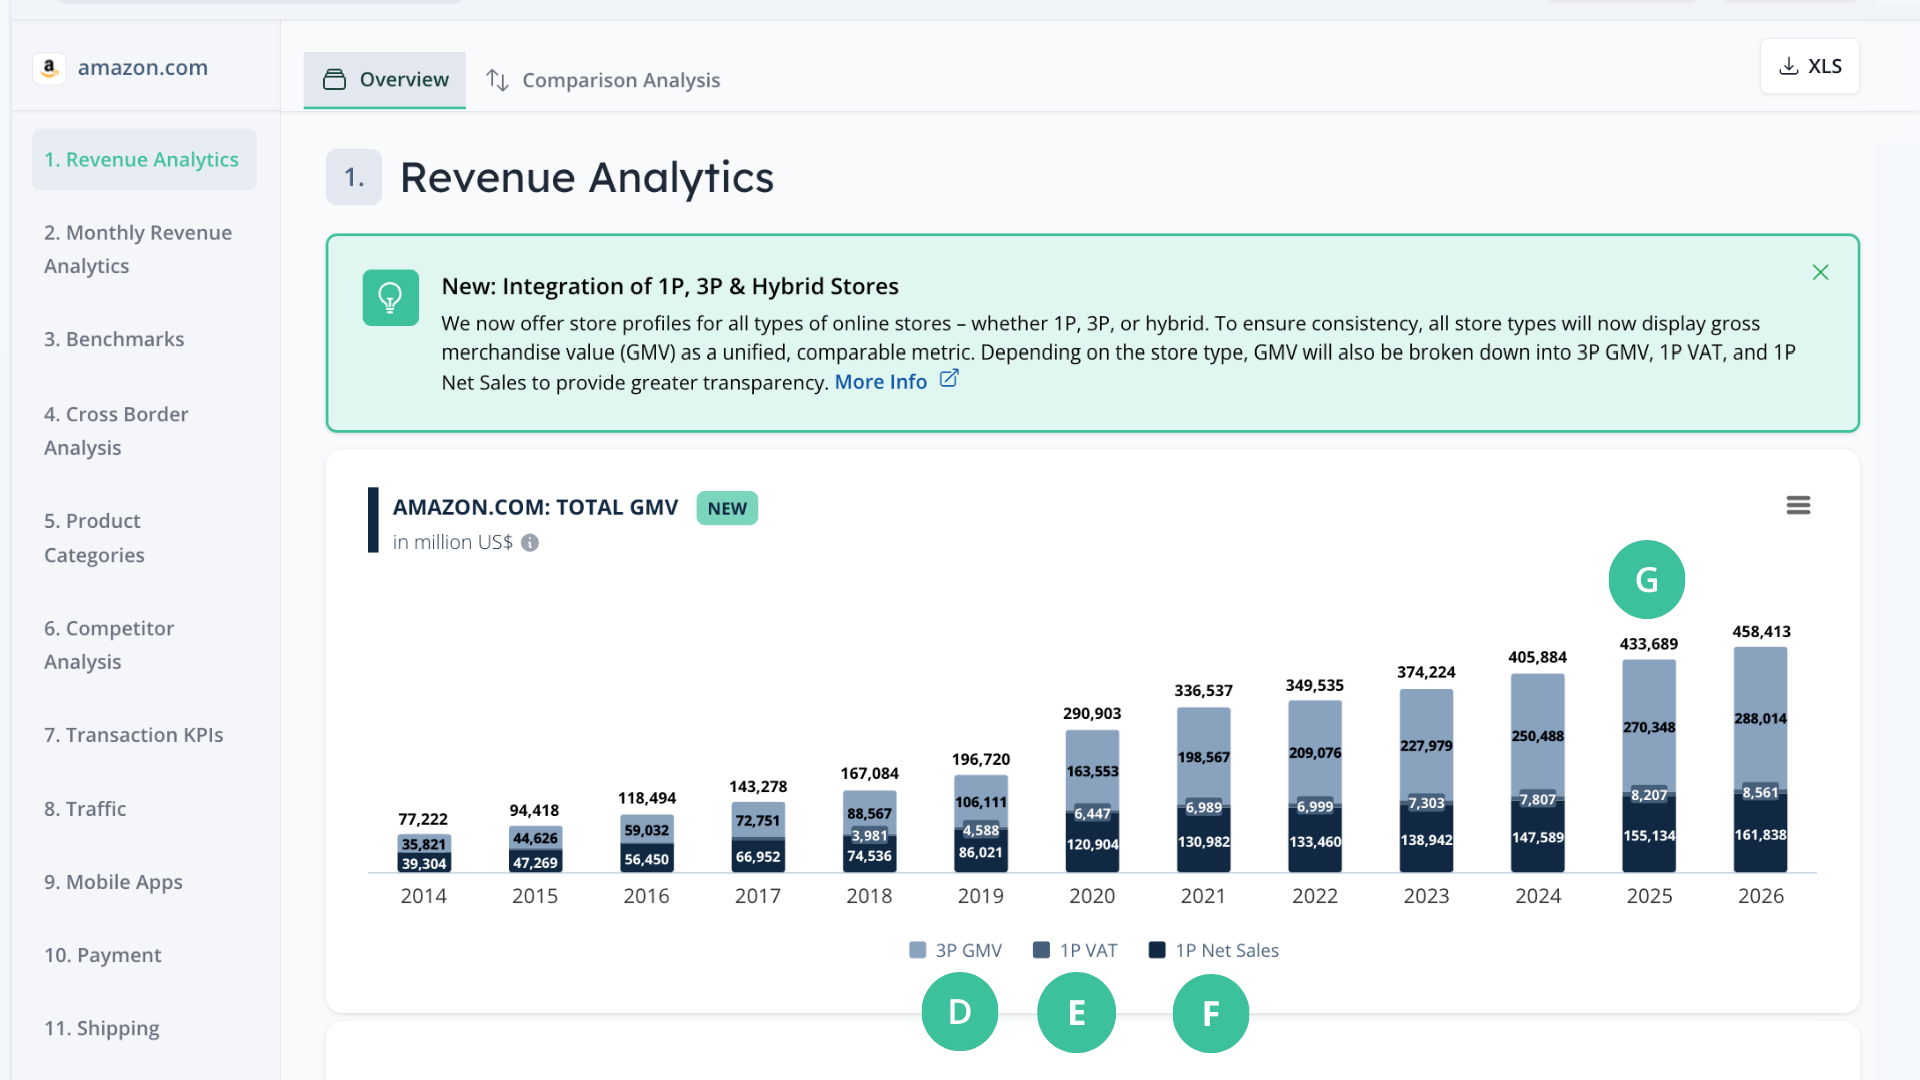
For every retailer, it is now possible to check their share of 1P and 3P revenue on Total GMV. This leads to a more comprehensive view on how revenues stack up. With the case of amazon.com, the enclosed image shows the illustration of revenue types. They include
D. 3P GMV: Denotes the third-party gross merchandise value of products generated through external sellers on a platform.
E. 1P VAT: Is first-party VAT, which is added onto 1P Net Sales to ensure comparability between net and gross figures.
F. 1P Net Sales: Represents first-party net sales that are generated through the sale of own-branded inventory.
G. Total GMV: Is the standardized, gross figure of all revenue types that ensures comparability between platforms of different business models.
What this means: The updated view enhances research capabilities, as it is now possible to filter for net sales only, net sales including VAT or GMV. Ultimately, the revenue types together result in Total GMV that encompasses all types of revenue.
Rankings often oversimplify and don’t reflect the full picture or are erroneous due to a different revenue logic. Accurately analyzing, ranking, and comparing retailers takes more time and effort – which is exactly what ECDB has invested. The different business models were previously split into separate rankings and retailer definitions, but that made comparisons difficult.
Now, ECDB has restructured the rankings and revenue calculations to better reflect market realities as they are perceived by participants. This provides a clearer and more consistent view of the market and how companies actually operate and compete.

Related Articles
Temu, TikTok and Shein are known for their low cost and high product variety: Here is proof that they are primarily used by younger shoppers. But exceptions remain.
Agentic commerce is a new way of shopping that affects retail platforms and sellers alike and is poised to become the dominant source in product discovery and purchase decisions.
Singles Day 2025 remains the world’s biggest eCommerce event — but mostly in name. While the date 11.11 (Single Day 11.11) gains recognition outside Asia, real participation is still centered in China, where Alibaba, JD.com, and Pinduoduo dominate sales and where live commerce continues to reshape digital retail. Globally, awareness exists — but engagement remains limited.
Click here for
more relevant insights from
our partner Mastercard.
Book a demo to see how ECDB's market intelligence can support your business.