
Konga Company & Revenue
Revenue (GMV)
Global Rank
Conversion Rate
Average Order Value
Unlock The Full Data Set For This Retailer
The values shown here refer to the retailer's largest online store. Aggregated total figures and values for other stores can be found in our tool.
Jump to section
Konga Revenue & Turnover
Konga Annual Revenue & Growth by Year
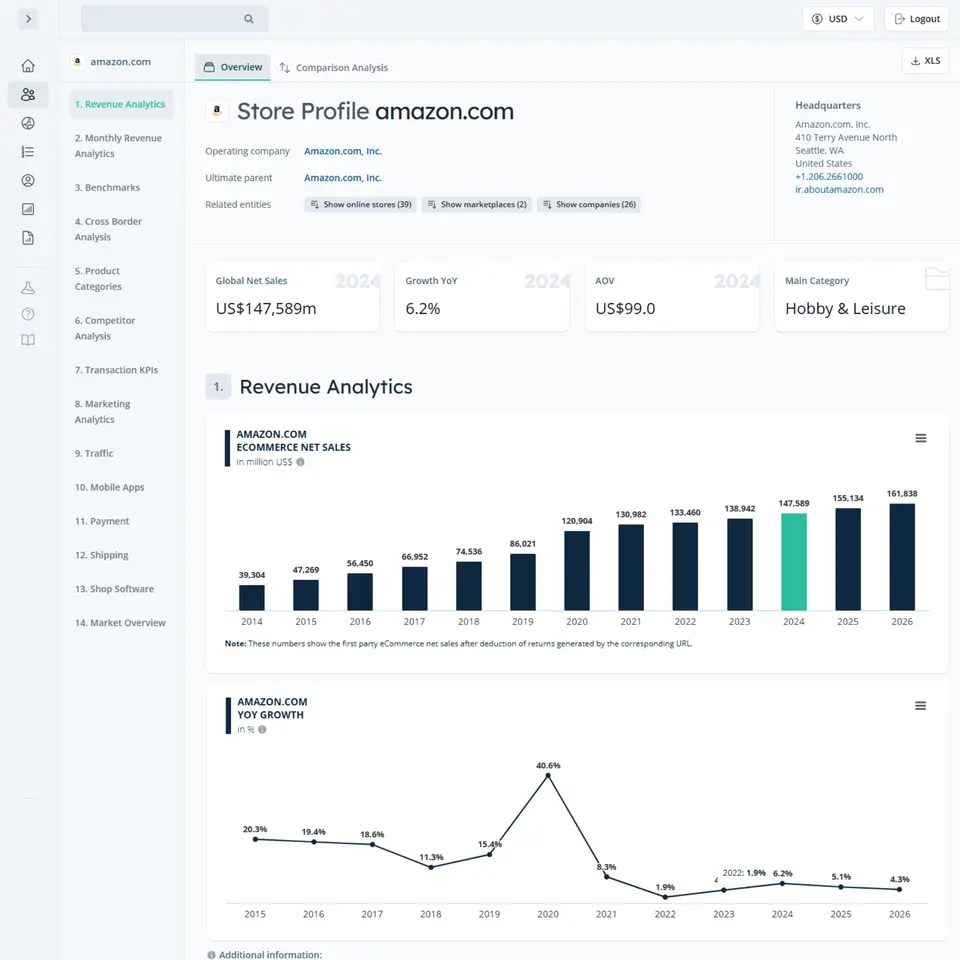
Konga's annual sales on its online store konga.com amounted to US$96m in 2024. This represents a change of 0-5% from the previous year. Konga's largest online store is expected to see a growth rate of 0-5% in 2025 compared to 2024, indicating a projected shift in performance.
Annual Revenue (GMV)
Annual Growth Forecast
E-Commerce Revenue (GMV in Million US$)
Note: This chart is based on the GMV of the online store. Click here to learn more about our methodology and the available drilldown at ECDB.
Test the ECDB Tool for Free
Access real data examples from our platform. See how ECDB helps you uncover e-commerce insights with ease.
Konga Monthly Sales & Revenue Development
Retailers follow monthly revenue patterns, which depend on annual events, consumer habits, and economic conditions. In the case of Konga, revenues in November of 2025 were US$9m on its domain konga.com. This marks a change in monthly revenues of <0% from October.
Revenue Current Month (GMV)
Growth from Previous Month
Monthly E-Commerce Revenue (GMV in Million US$)
Note: This chart is based on the GMV of the online store. Click here to learn more about our methodology and the available drilldown at ECDB.
Get Monthly Revenue Data with Seasonal Insights
Access consistent revenue data for the past 12 months - updated every month to help you track trends and seasonality.
Konga Sales by Country & Market Shares
Konga's main market is Nigeria, where its main online store, konga.com, generated 100% of revenues in 2024. Konga engages in markets that support its strategic objectives, whether through domestic focus or cross-border expansion.
Market Shares by Country

Unlock Detailed Country-Level Revenue Data
Access an exact and granular breakdown of a retailer's revenue across all countries. Includes consistent country share values – ideal for in-depth market analysis.
Explore ECDB for Free
Konga Revenue Split by Product Categories
Konga sales by product category provide a deeper look into its income structure. Konga's most significant category is Fashion, which accounts for 35% of total sales in 2024 at its largest online store, konga.com. The analysis of sales by category provides a clearer picture of how different segments contribute to overall performance.
Revenue Breakdown by Category
Fashion (35%)
Get the Complete Category Split
Konga Marketplace Sales: 1st & 3rd Party GMV
1P vs 3P Revenue/Sales
Konga's marketplace sales are illustrated by its GMV development. A distinction is made between 1P (first-party) and 3P (third-party) sales, where Konga either acts as the seller (1P) or distributes products from other sellers (3P). In 2024, Konga's' 1P sales contributed 0% to total GMV, while the 3P GMV accounted for 100%.
3P Share
3P Share Forecast
20251P/3P Revenue/Sales Split
See the Exact 1P vs. 3P Split
Get exact values instead of ranges – with 10 years of historical and forecast 1P/3P splits at your fingertips.
Try ECDB Now
Start Exploring ECDB - Free & No Strings Attached
- Real Samples:
- Explore actual data in action
- Profile Variety:
- Access both Retailer and Market Profiles
- Zero Cost:
- No credit card or billing info needed
Konga Top Stores
Konga's flagship domain konga.com generated revenues of US$96m in 2024. Forecasts expect a revenue change of 0-5% in the coming year.
Top Online Stores by GMV (in Million US$)
konga.comIdentify Top Stores with Full Revenue Breakdown
- Identify top stores including their detailed revenue development
- Wide-ranging revenue distribution on store level
- Detailed profile for every store
| Position | Store | 2020 | 2021 | 2022 | 2023 | 2024 | 2025 |
|---|---|---|---|---|---|---|---|
| 1. | konga.com Konga Online Shopping, Ltd. | 96 |
Identify Top Stores with Full Revenue Breakdown
- Identify top stores including their detailed revenue development
- Wide-ranging revenue distribution on store level
- Detailed profile for every store
Note: This ranking is based on GMV. Click here to learn more about our methodology and the drilldown available at ECDB.
Konga Transaction KPIs: Conversion Rate, Average Order Value
Analyzing transactions on Konga's largest online store konga.com reveals key metrics like conversion rate, average order value, discount rate, and return rate. The store's conversion rate reached 0.5-1.0% in 2024, offering insight into user behavior.
See the Exact Transaction Data
Unlock exact transaction data behind the ranges – for precise benchmarking and deeper insights.
Average Order Value
Return Rate
Discount Rate
Konga Payment, Shipping and Shop Software Provider Landscape
Payment and shipping options have a major impact on customer satisfaction. In the case of Konga, the payment providers VISA (Cards), Mastercard (Cards) and Verve Card (Cards) are available at its largest online store, konga.com. Shipping providers, on the other hand, vary significantly depending on the market. Overall, konga.com offers KOS Delivery Courier.
Payment Provider
Shipping Provider
Shop Software


View All Payment and Shipping Methods Offered by This Retailer
- Exhaustive list of all payment and shipping methods
- Breakdown of shop software usage including version
Get Free Data Samples in the ECDB Tool
Browse selected retailer and market insights and explore real data samples.
More Retailers
Ready To Get Started?
Find your perfect solution and let ECDB empower your e-commerce success.