Article in a Nutshell
Fashion leadership driven by frequency and AOV: The US leads with over 9 fashion purchases per year and the highest average order value, while Germany and France lag due to less frequent shopping.
Market size can amplify revenue: Countries like the UK approach top-tier spending despite smaller populations thanks to high frequency and AOV.
Grocery shows uniform spending patterns: High buying frequency (6–13 times/year) with stable AOV (~US$100) dominates, driven by recurring needs for perishables.
Growth comes from different levers: Some markets are in leadership positions through frequent, high-value purchases, others through buyer volume.
Fashion and Grocery are two of the most significant e-commerce categories. Looking at their growth shows they are shaped by different spending patterns though. An examination of the top 10 e-commerce countries shows why.
Fashion: Frequency and AOV Drive the Market
In fashion, the United States clearly takes the lead. US consumers shop for fashion over 9 times per year, spending the highest average order value (AOV) among all countries analyzed. The combination of frequent shopping and high spend per purchase drives the US’s dominance in fashion e-commerce.
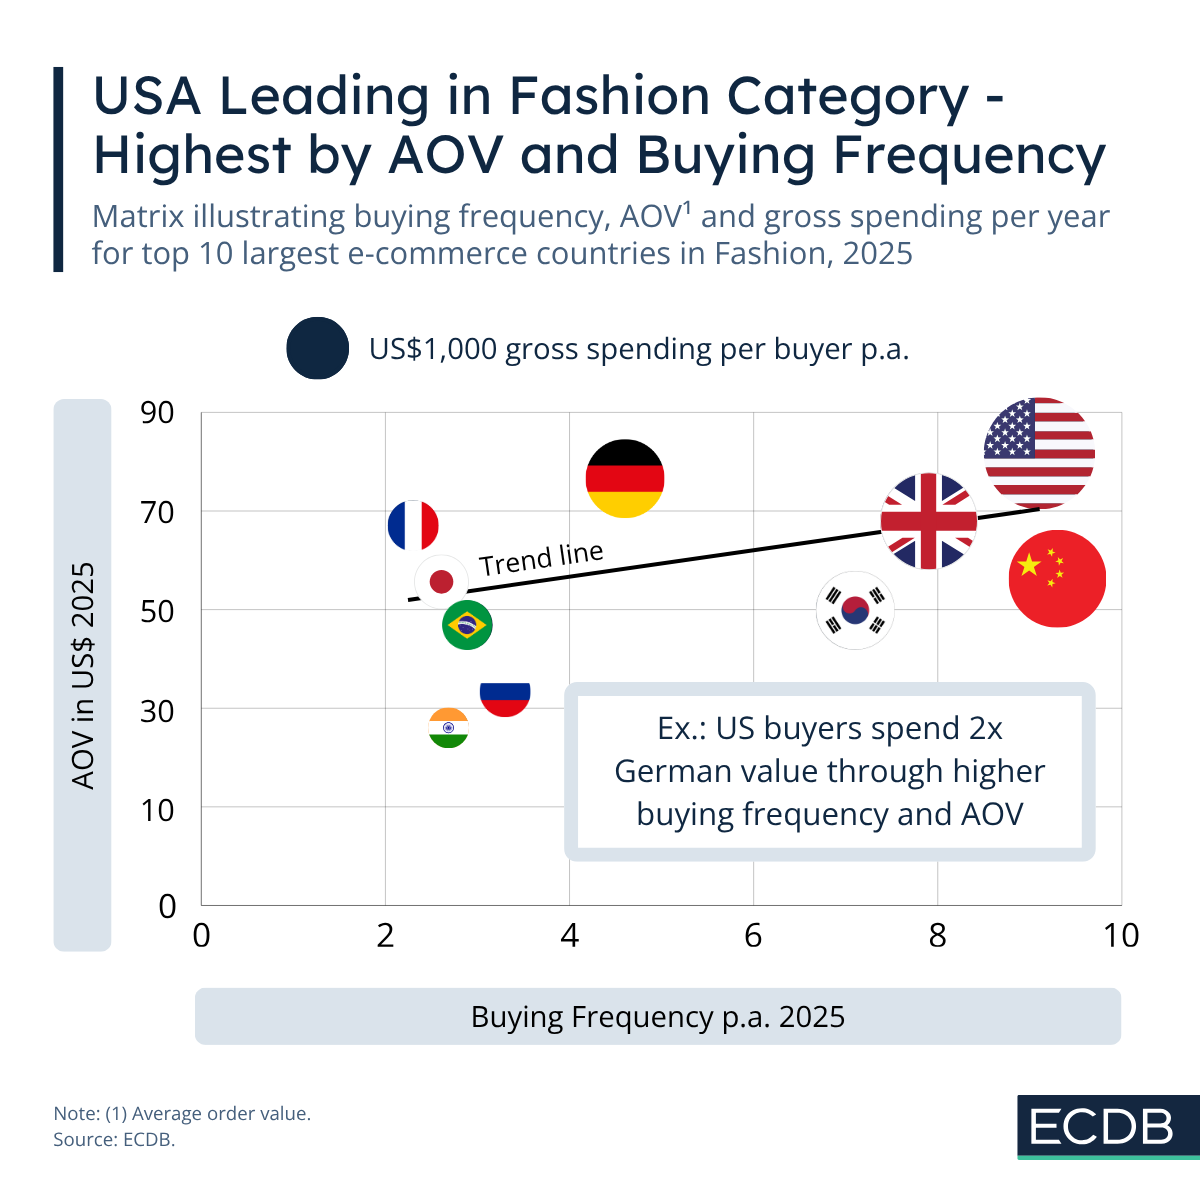
Germany tells a different story. Here, the annual spend per buyer is about half that of the US: Not because Germans spend significantly less per order, but because they shop less frequently, averaging just 5 purchases per year. France falls even lower, with both a slightly smaller AOV and lower buying frequency. These differences in purchasing behavior make the difference between a leading market and a follower.
While market size plays a role, it is not all. Take the UK for example. With a buyer base of around 68 million (compared to 63 million in Germany and 242 million in the US), the UK is almost at the level of the United States in Fashion because of a high buying frequency and AOV.
Grocery: Frequency Leads, AOV Stabilizes
Grocery e-commerce is more uniform in spending patterns. Markets like Germany, the US, China, France, the UK, and South Korea show high buying frequency: Consumers buy grocery from 6 to 13 times a year, while the AOV remains relatively stable around US$100. It shows how recurring orders of perishables drive high buying frequency, facilitating the day-to-day of online grocery shoppers.
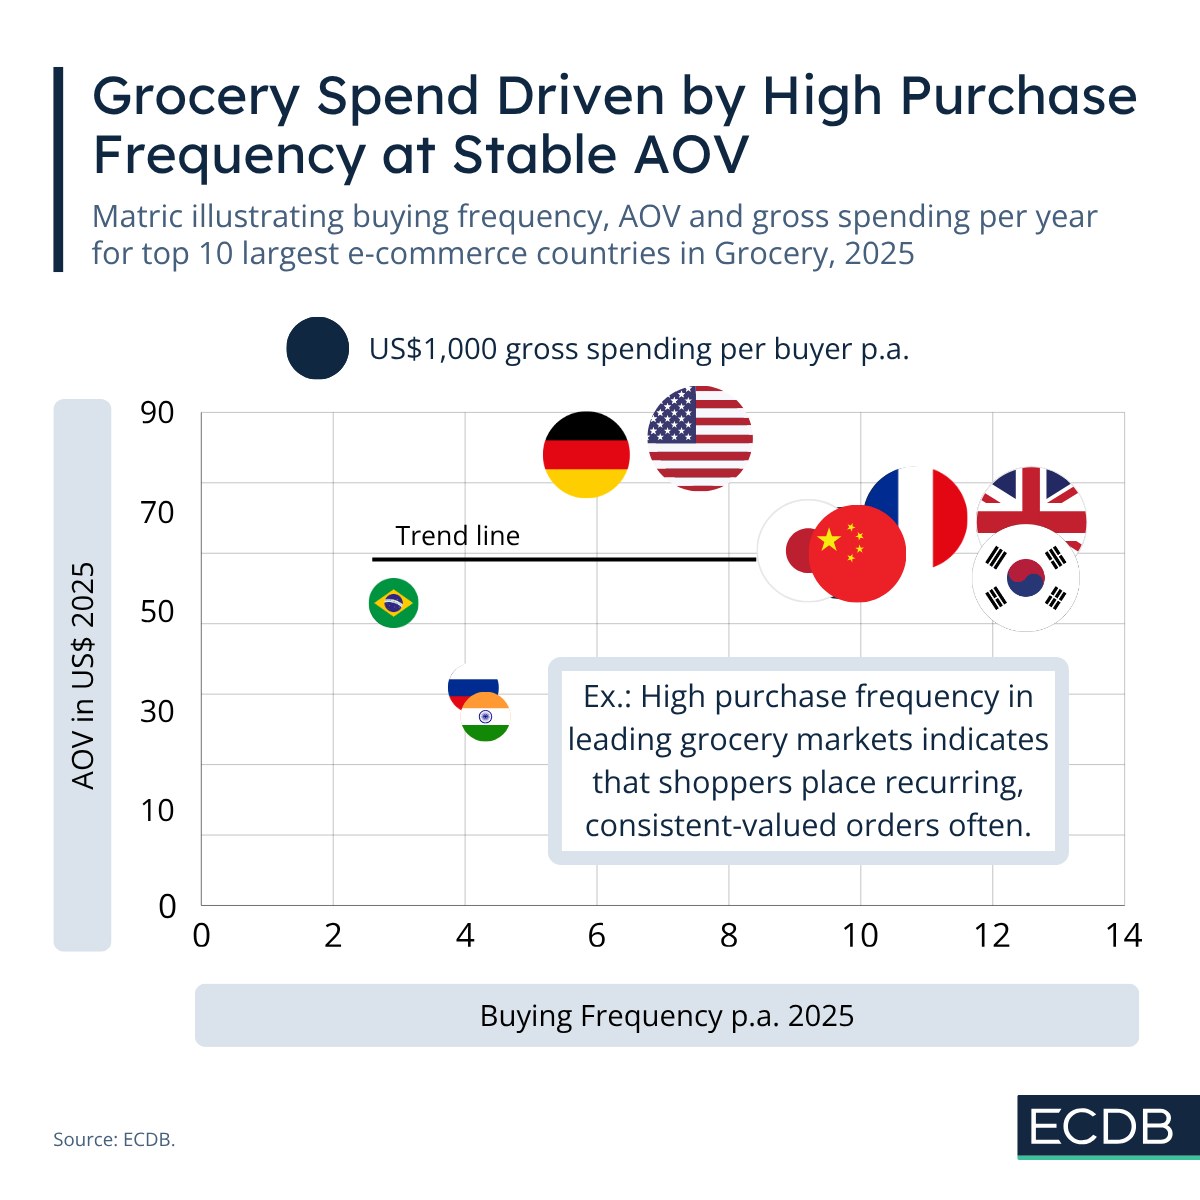
In both fashion and grocery, countries with smaller flags indicate lower annual spend per buyer. This can result from less frequent shopping or lower AOV. Yet, even with smaller individual spend, sheer market size can generate significant revenue.
Brazil, Russia, and India are prime examples. Brazil's shopper base is at 92 million, Russia's is at 89 million and India's at 207 million - tendency growing. A growing number of buyers, as well as increasing AOV and purchase frequency will assist growth in each market.
Different Paths to Leadership
Ultimately, markets grow differently. Some claim their top position through consumer behavior that is rooted in frequent shopping and high spend, while others grow through the volume of the shopper base. The spending patterns are helpful to discern potential for growth and provide benchmarks for own business performance metrics.