How to Conduct Proper E-Commerce Benchmarking to Know Where You Stand
E-commerce benchmarking is the sequence of questions a business asks to know where it stands. This article shows how to run that sequence, using a real-world example.
Actionable Steps
E-commerce revenue only moves through three levers: more buyers, more frequent purchases, or bigger orders. Here is what works best.

Nadine Koutsou-Wehling
Data Journalist
August 14, 2026
Other
Article in a Nutshell:
Revenue breaks down to buyers times purchase frequency times average order value, and the businesses that grow fastest are the ones that diagnose which of the three is actually underperforming before spending on any of them.
Single-category D2C brands hit a frequency ceiling most never break through, 1.07 to 2.17 orders a year across brands like Warby Parker or Bombas and Rothy's, next to a generalist's 20-plus.
Cart abandonment doesn't just track how expensive a category is. Furniture & Homeware abandons 83.81% of carts, more than Bullion & Precious Metal's 66.69%, even though precious metals cost far more per order.
Revenue in e-commerce comes down to a simple multiplication: the number of people buying, how often each one buys, and how much they spend per order. Every growth tactic that actually works pulls on one of those three numbers.
The businesses that grow fastest are the ones that work out which of the three numbers has the most room to move before deciding where to spend.
More buyers is the lever most businesses reach for first, and it's also the one most often pointed at the wrong market.
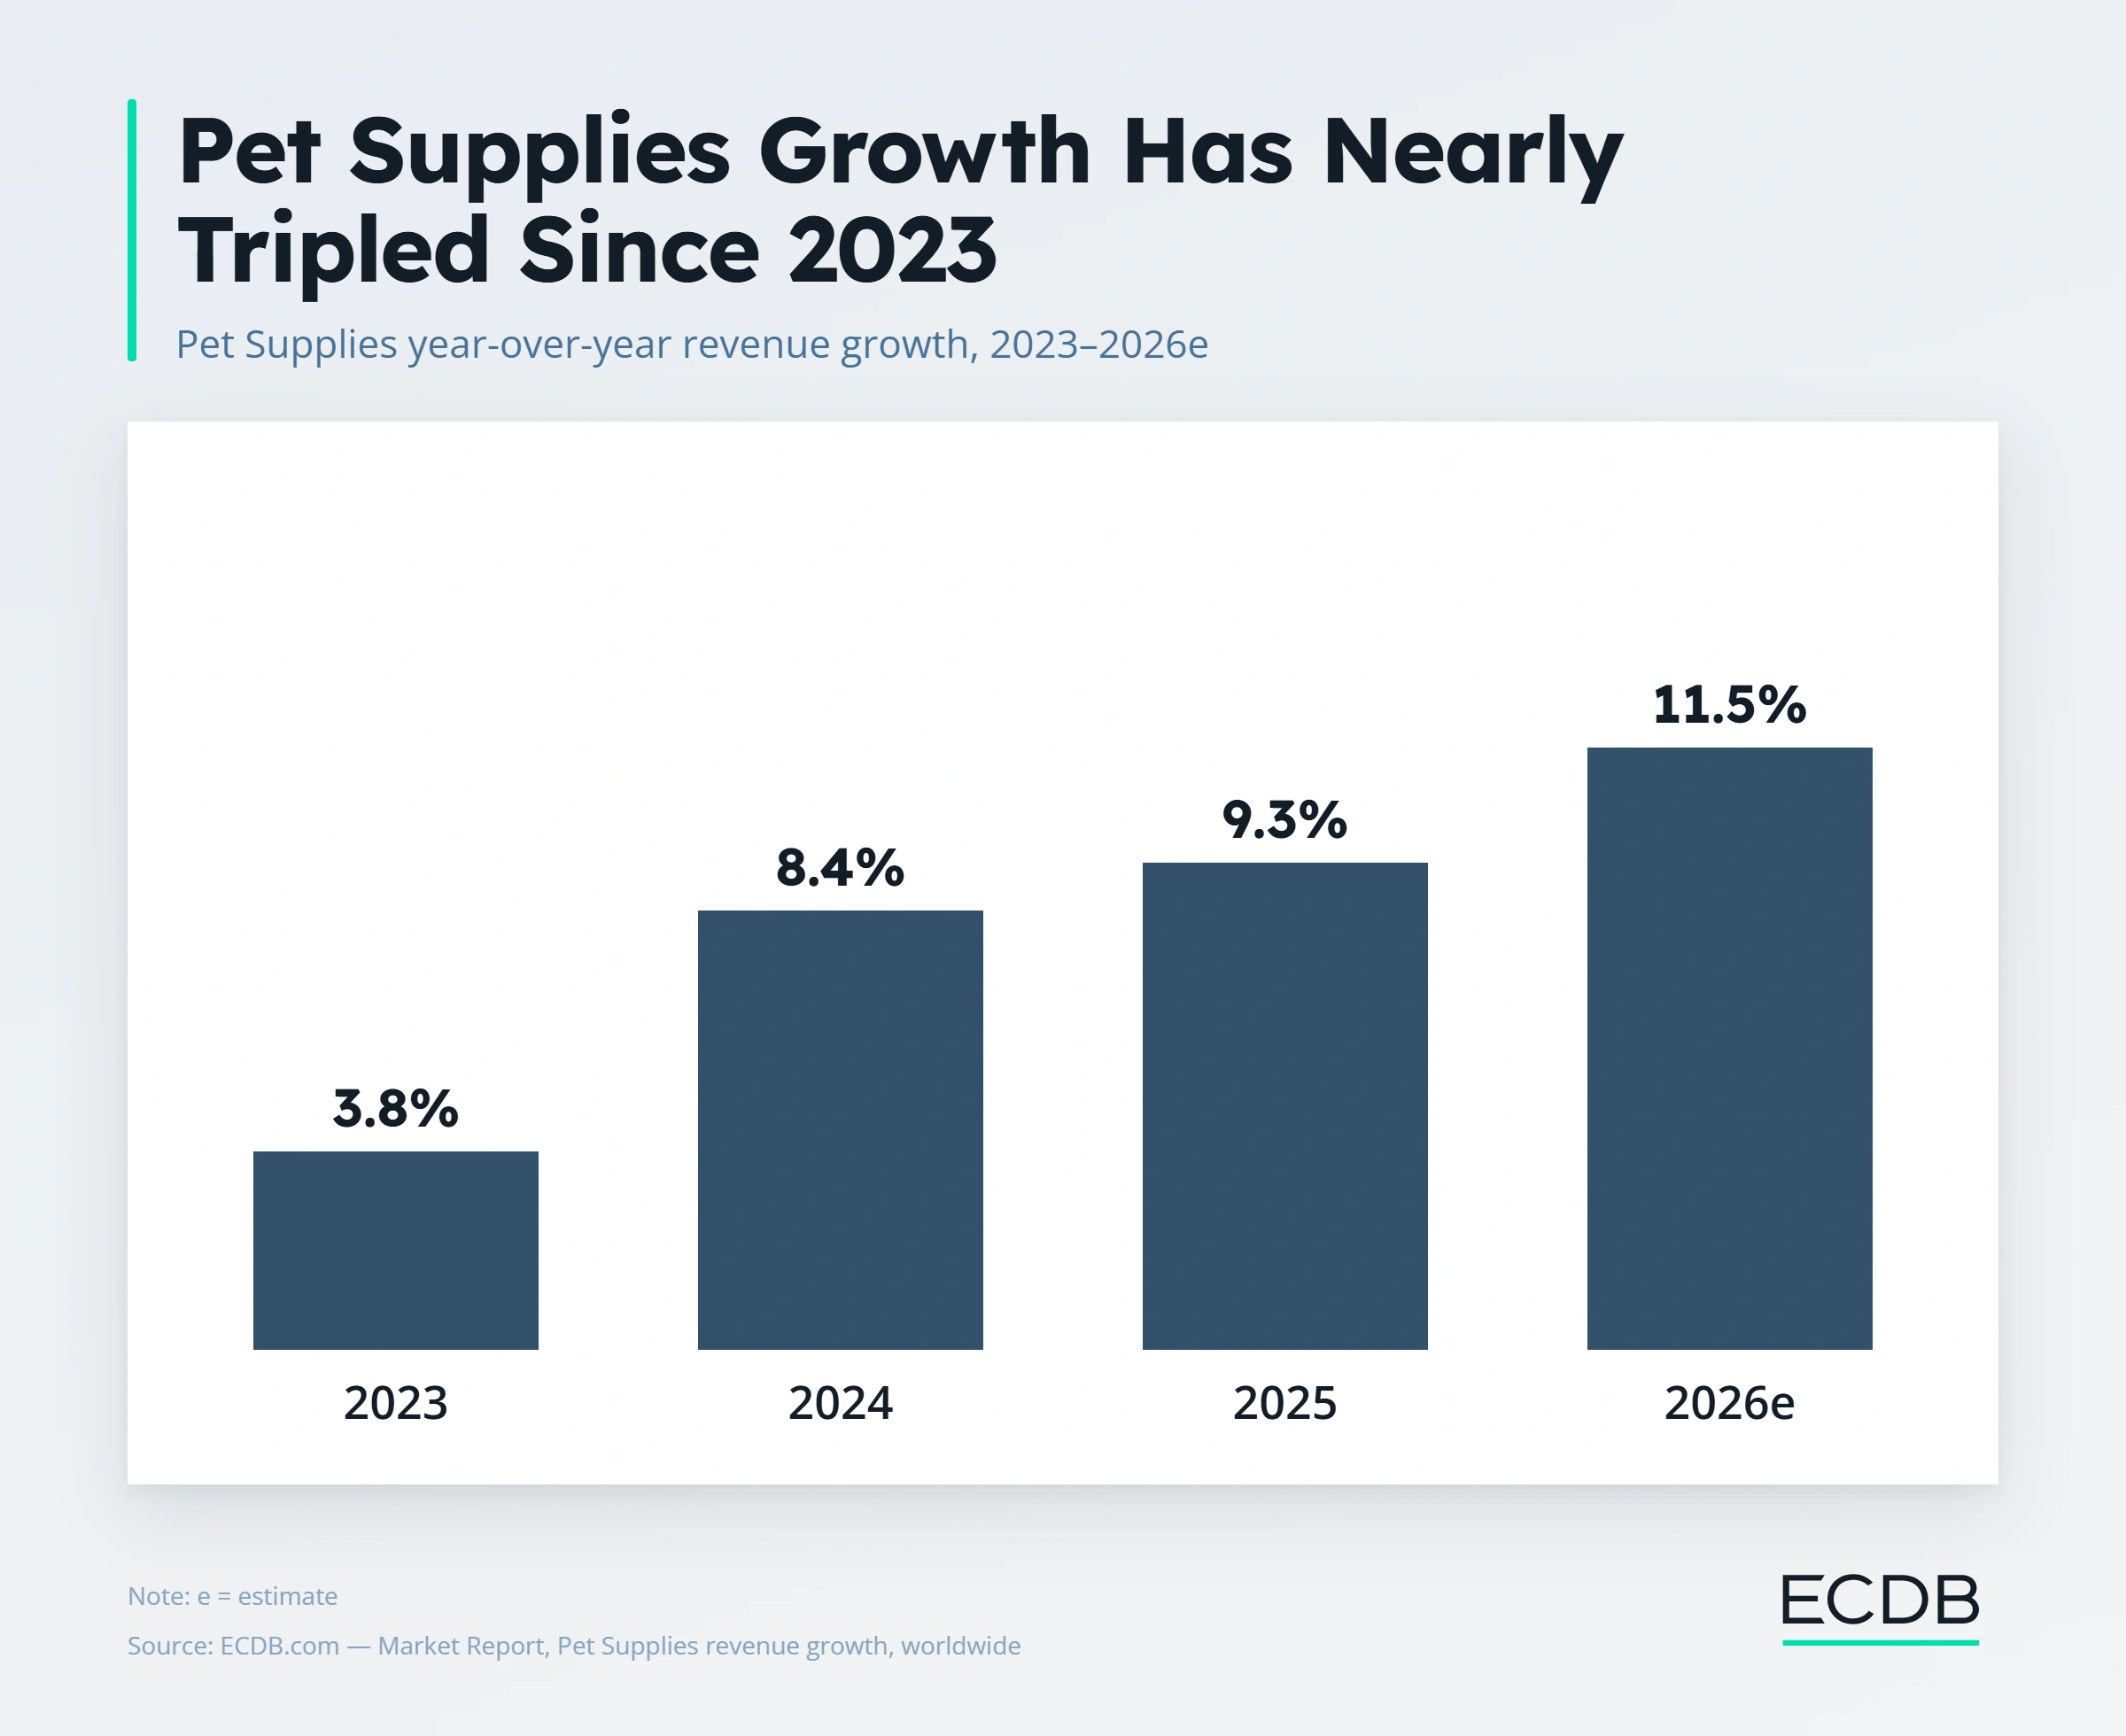
Pet Supplies has nearly tripled its growth rate since 2023, from 3.77% to a projected 11.53% in 2026, on its way to a US$77 billion category in 2026. That's the kind of market where new buyers are still showing up faster every year.
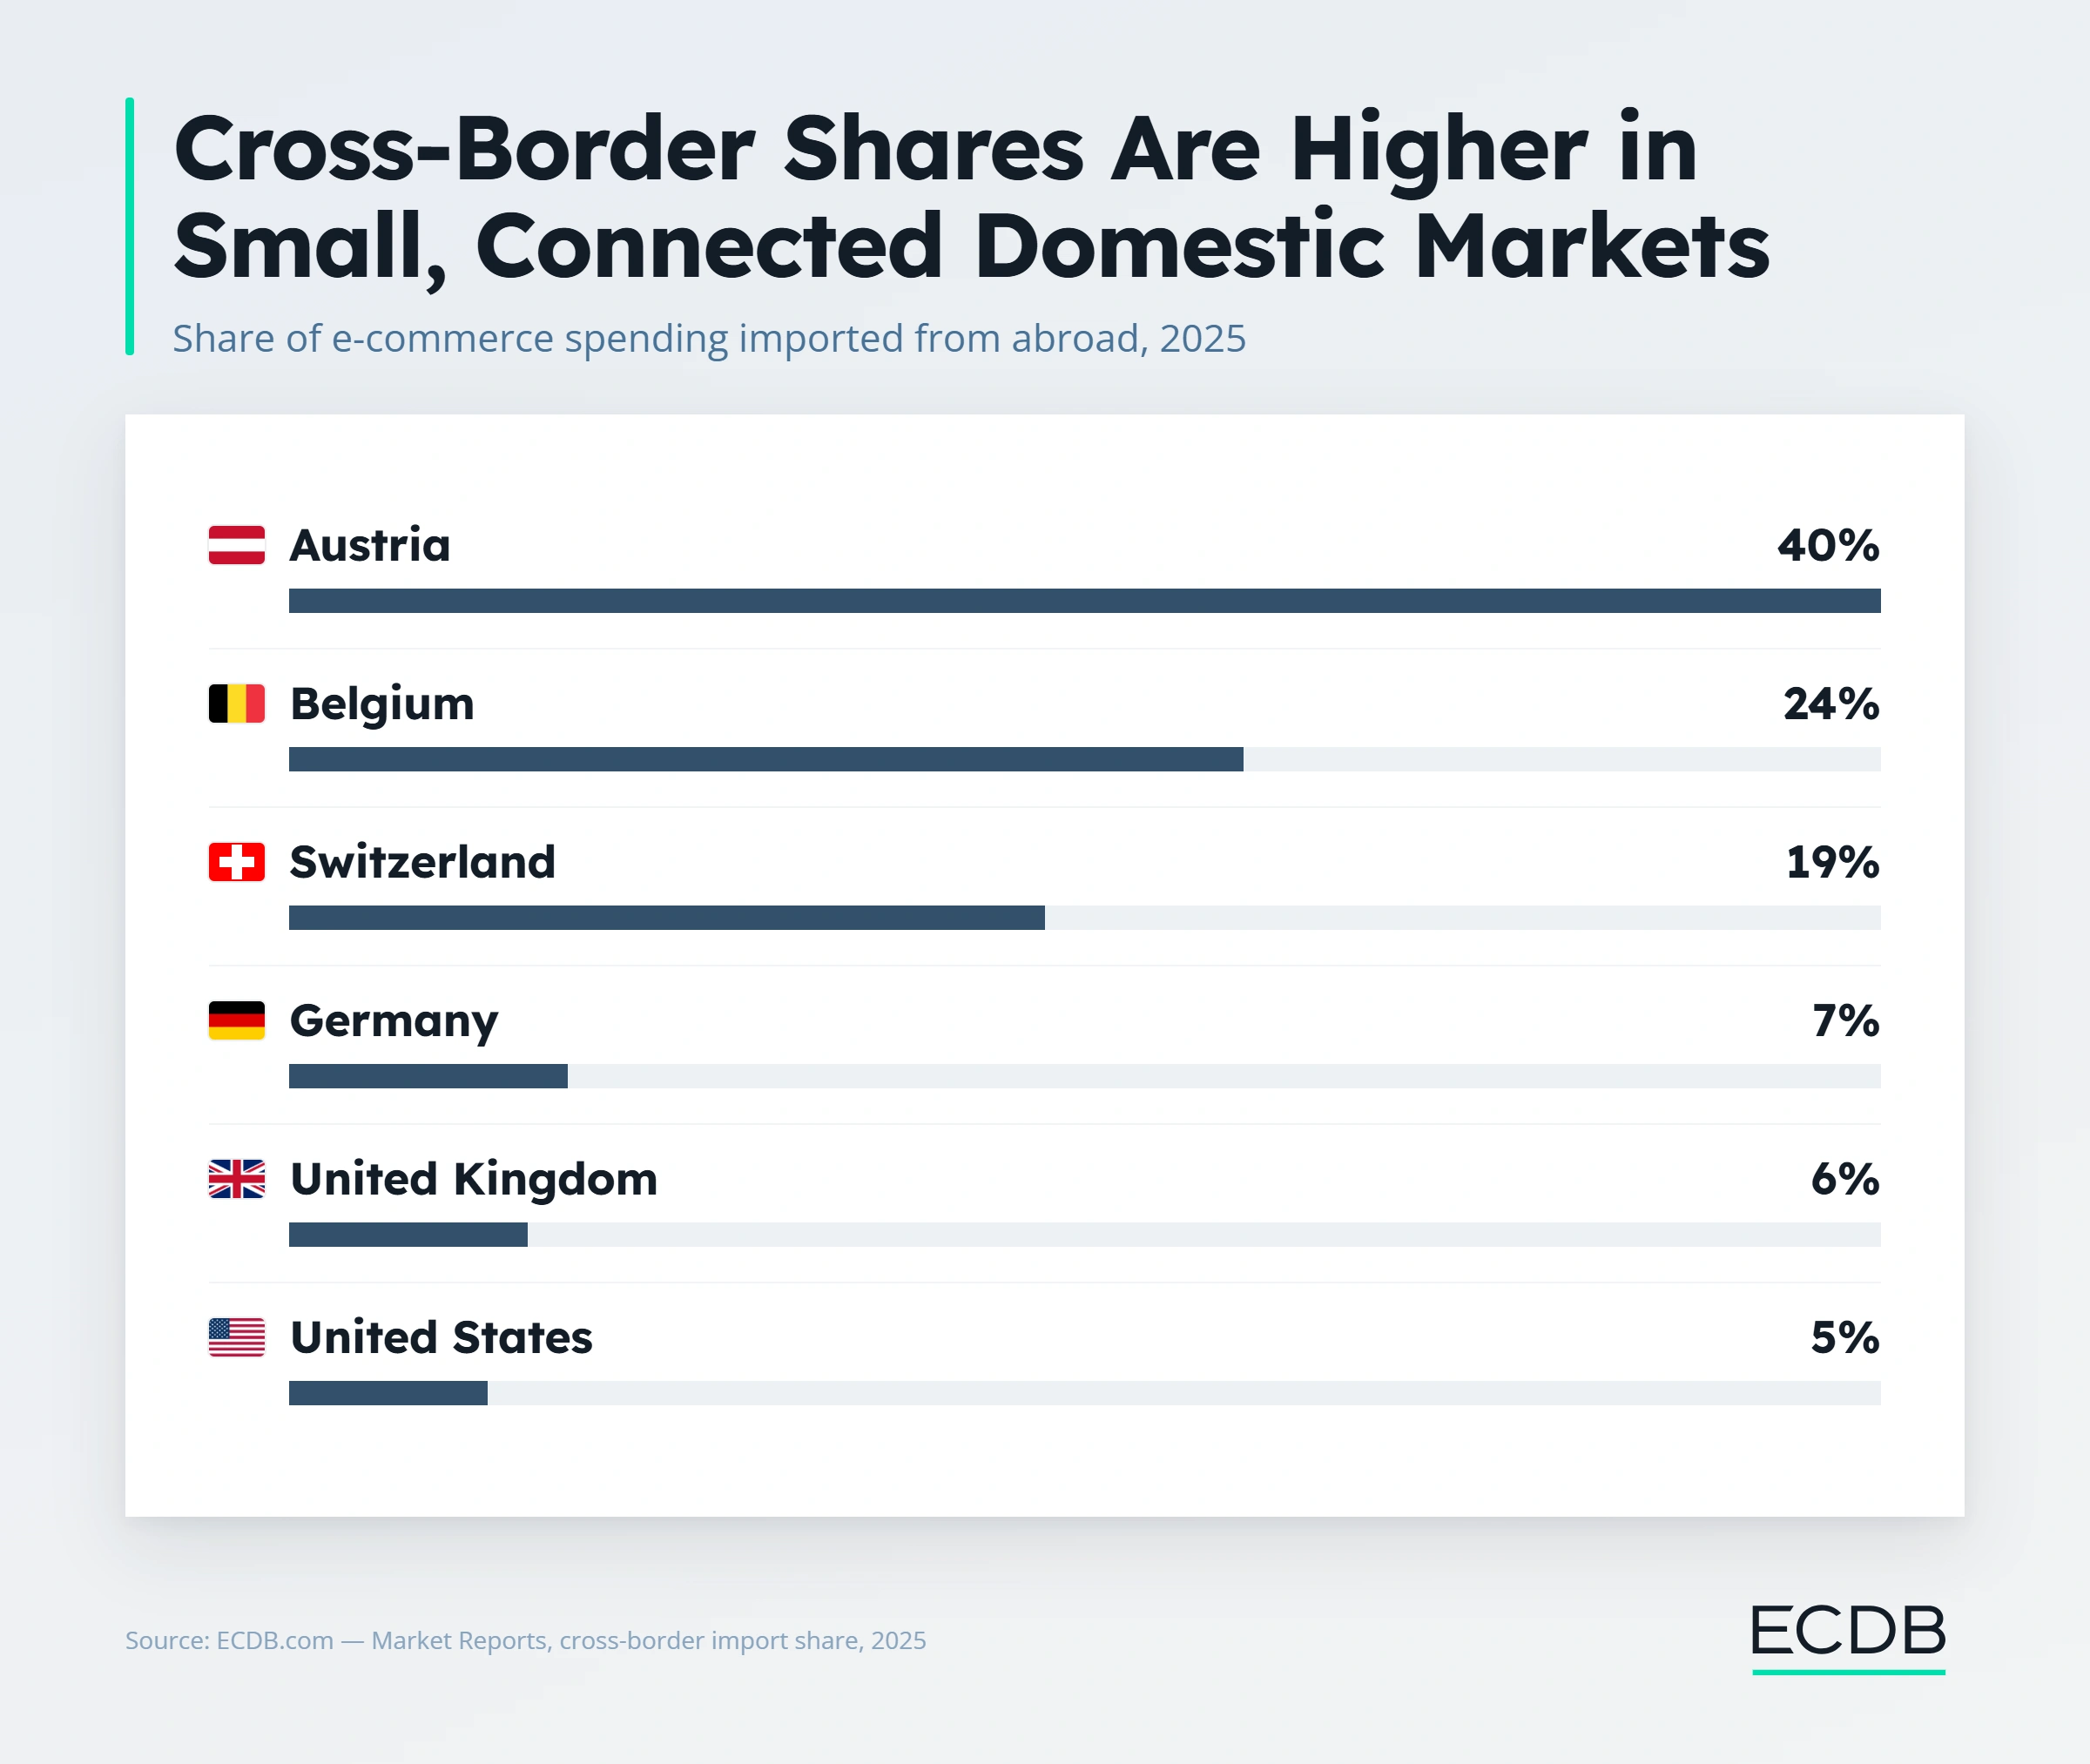
Geography is the other underused source of new buyers. Austria already sources 40% of its e-commerce from abroad, Belgium 24%, next to Germany's 7% and the US's 5%.
Larger, more self-contained markets are the exception, not the rule.
A business that only ever sells domestically is leaving out an entire group of buyers: the ones already comfortable purchasing across a border. Cross-border expansion works precisely because a meaningful share of shoppers are already primed for it, not because it's a bet on future behavior.
Purchase frequency is the lever with the most room to move for most single-category businesses, and also the one most likely to run into a hard ceiling. Warby Parker's customers buy just 1.07 times a year, glasses aren't something most people replace often.
Bombas and Rothy's both sit at 2.17. None of these numbers are a sign of a poorly run business, they're the realistic frequency for a single-category brand, since there are only so many times a year someone needs new glasses, socks, or shoes.
A generalist marketplace selling everything from electronics to groceries can see the same customer more than twenty times a year, not because it executes better, but because it gives that customer more distinct reasons to come back.
That's the real lesson for a single-category brand trying to move this lever: working harder on retention emails rarely fixes it. Giving customers an adjacent reason to return, one that has nothing to do with the last thing they bought, usually does.
A subscription mechanic works for the same reason. It turns an irregular purchase into a scheduled one instead of trying to manufacture new occasions to buy.
Average order value is the most visible lever and the easiest to move in a way that backfires. A full breakdown of how AOV varies by category and what actually works to raise it deserves its own analysis, but the short version is that the right tactic depends entirely on whether a category is bought often and cheaply or rarely and deliberately.
For frequent, low-cost categories, three moves work well:
Subscription or auto-replenishment pricing.
Multi-pack bundling on items already bought on a cycle.
A free-shipping threshold set just above the typical basket size, close enough that reaching it feels effortless rather than forced.
For rare, high-cost categories, three different moves work instead:
Financing or installment options that make a large purchase feel smaller upfront.
Trust signals like reviews and warranties, placed right where hesitation peaks.
Premium add-ons tied to the purchase itself, extended warranties or white-glove delivery, rather than volume discounts that don't match how the category gets bought.
Pushing the wrong tactic onto the wrong category, bundling discounts on a considered purchase, or a high minimum-order threshold on a routine one, tends to suppress the other two levers to gain this one.
The businesses that get this right treat AOV as the last lever to pull, not the first, because it's the one most likely to trade off against frequency or buyer acquisition if it's not matched to how the category actually gets bought.
There's a fourth number worth watching underneath all three levers, because it caps all of them at once: how many carts get built and then abandoned before checkout. The pattern here isn't what most businesses assume.
Furniture & Homeware abandons 83.81% of carts, the highest of any category checked here. Household Care, a much cheaper, more routine purchase, abandons 75.4%. Bullion & Precious Metal, the most expensive category by far, abandons only 66.69%.
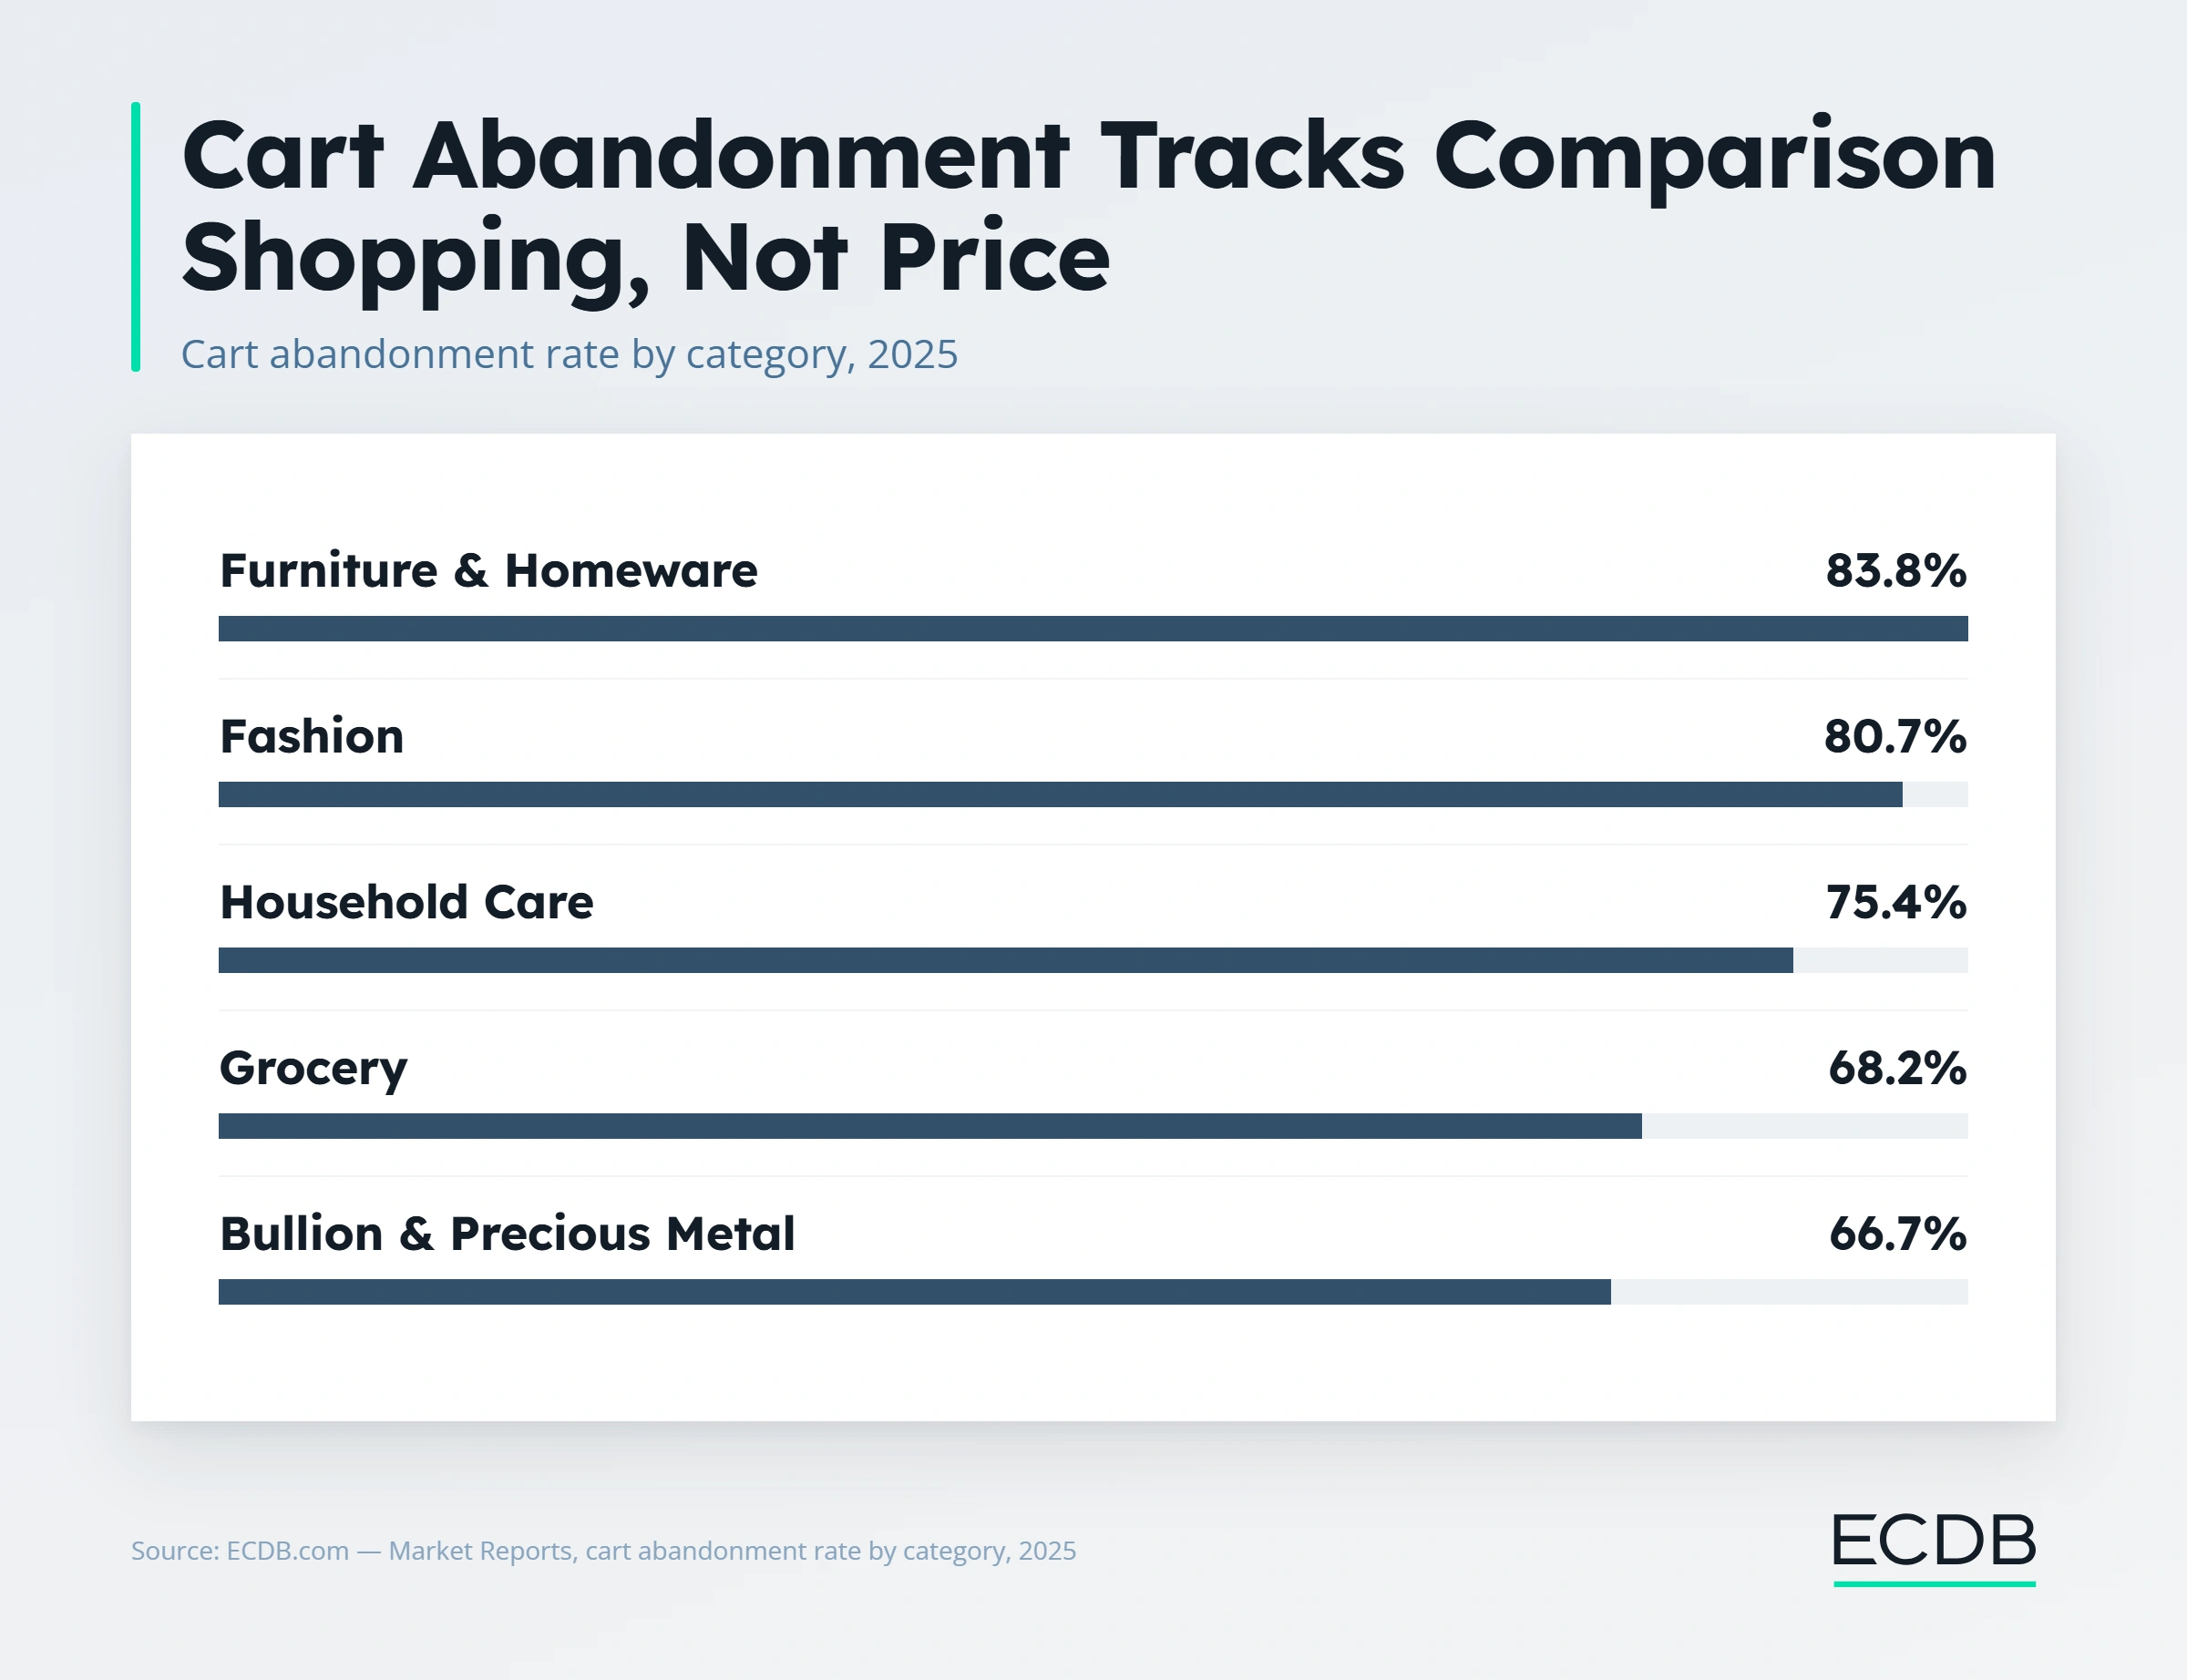
Cost isn't what predicts abandonment. Comparison shopping is. Furniture gets built into a cart and then checked against three other retailers before a decision gets made. A precious metals buyer has usually already decided to buy before adding anything to a cart at all, so there's less shopping around left to do at that stage.
That distinction changes what actually fixes abandonment in each case: a furniture retailer needs better reasons to convert during that comparison window, price matching, faster shipping guarantees, live chat, while a category with already-committed buyers gets less benefit from the same tactics and more from simply removing friction at the final step.
None of these four levers is universally the right one to pull, which makes the diagnosis step more valuable than any individual tactic.
A business with a good purchase frequency and a shrinking buyer base needs a completely different plan than one with plenty of new buyers who never come back a second time. Treating both problems with the same generic "grow sales" playbook wastes effort on the lever that was never the actual constraint.
That diagnosis holds regardless of the category: check whether new buyers, repeat frequency, order size, or checkout completion is furthest below what similar businesses in the same category achieve, and that's the lever actually worth building a strategy around. Not whichever one happens to be easiest to run a campaign against.
Every number behind these four levers, category size and growth, purchase frequency by brand, AOV, and cart abandonment, comes from data ECDB tracks across more than 18,000 categories and thousands of stores.
That makes it possible to check which lever a specific business is actually underperforming on relative to real category benchmarks, instead of guessing based on whichever metric looks worst on an internal dashboard.
In practice, that means using Category Explorer and Rankings to check whether a buyer-growth problem is a market problem or a competition problem, checking a business's own purchase frequency and AOV against Analyze & Compare's benchmarks for the same category, and using Profiles to see whether a fast-growing competitor is winning on frequency, AOV, or acquisition before copying their playbook wholesale.
Related Articles
E-commerce benchmarking is the sequence of questions a business asks to know where it stands. This article shows how to run that sequence, using a real-world example.
Mobile commerce stacks at least six different channels on top of each other. Most strategies only optimize for one or two of them at a time.
An e-commerce strategy is a plan for growing online sales with intention. Using ECDB, this article runs an illustrative analysis to show how that plan comes together.

Click here for
more relevant insights from
our partner Mastercard.
Book a demo to see how ECDB's market intelligence can support your business.