E-Commerce Return Rate by Category: Which Products Get Sent Back Most?
Fashion returns get sent back at more than four times the rate of the lowest category. The reason is deeply tied to user behavior.
Transaction KPIs
Average order value looks like a checkout problem. The data says it's mostly a category problem, and the right fix depends entirely on which category you're actually in.

Nadine Koutsou-Wehling
Data Journalist
August 14, 2026
Transactions
Article in a Nutshell:
AOV ranges from US$40 in Household Care to US$574 in Bullion & Precious Metal, a 14x spread across categories, and that gap tracks how often and how deliberately people buy, not chance.
A higher AOV doesn't automatically mean a more valuable customer. Amazon's US$72.80 AOV and 21.95 annual purchases add up to US$1,598 a year per customer, more than double Chewy's US$591, even though Chewy's own AOV is higher at US$85.60.
The tactics that raise AOV in a low-consideration category, bundling, free-shipping thresholds, actively backfire in a high-consideration one, and the reverse is just as true.
Average order value (abbreviated AOV) measures basket size, that is how large an e-commerce order is. How to go about increasing its value is one of the most frequently asked questions in e-commerce, and yet the answer mostly depends on what you sell.
AOV is total revenue divided by number of orders over a given period. It tells you how big the average basket is. It doesn't tell you how often that basket gets filled, and treating AOV as the whole picture is how a business ends up optimizing the wrong number.
The two matter together. Multiply AOV by purchase frequency and the result is what a customer is actually worth in a year, which is a very different ranking than AOV on its own produces. A category or a competitor with a bigger basket size isn't necessarily winning. It might just be compensating for customers who don't come back very often.
The spread is bigger than most people expect, and it isn't random.
Household Care averages US$40.30 a basket.
Grocery runs US$86.68.
Fashion sits at US$125.71.
Furniture & Homeware reaches US$245.81.
Bullion & Precious Metal tops the list at US$574.44, fourteen times Household Care's average.
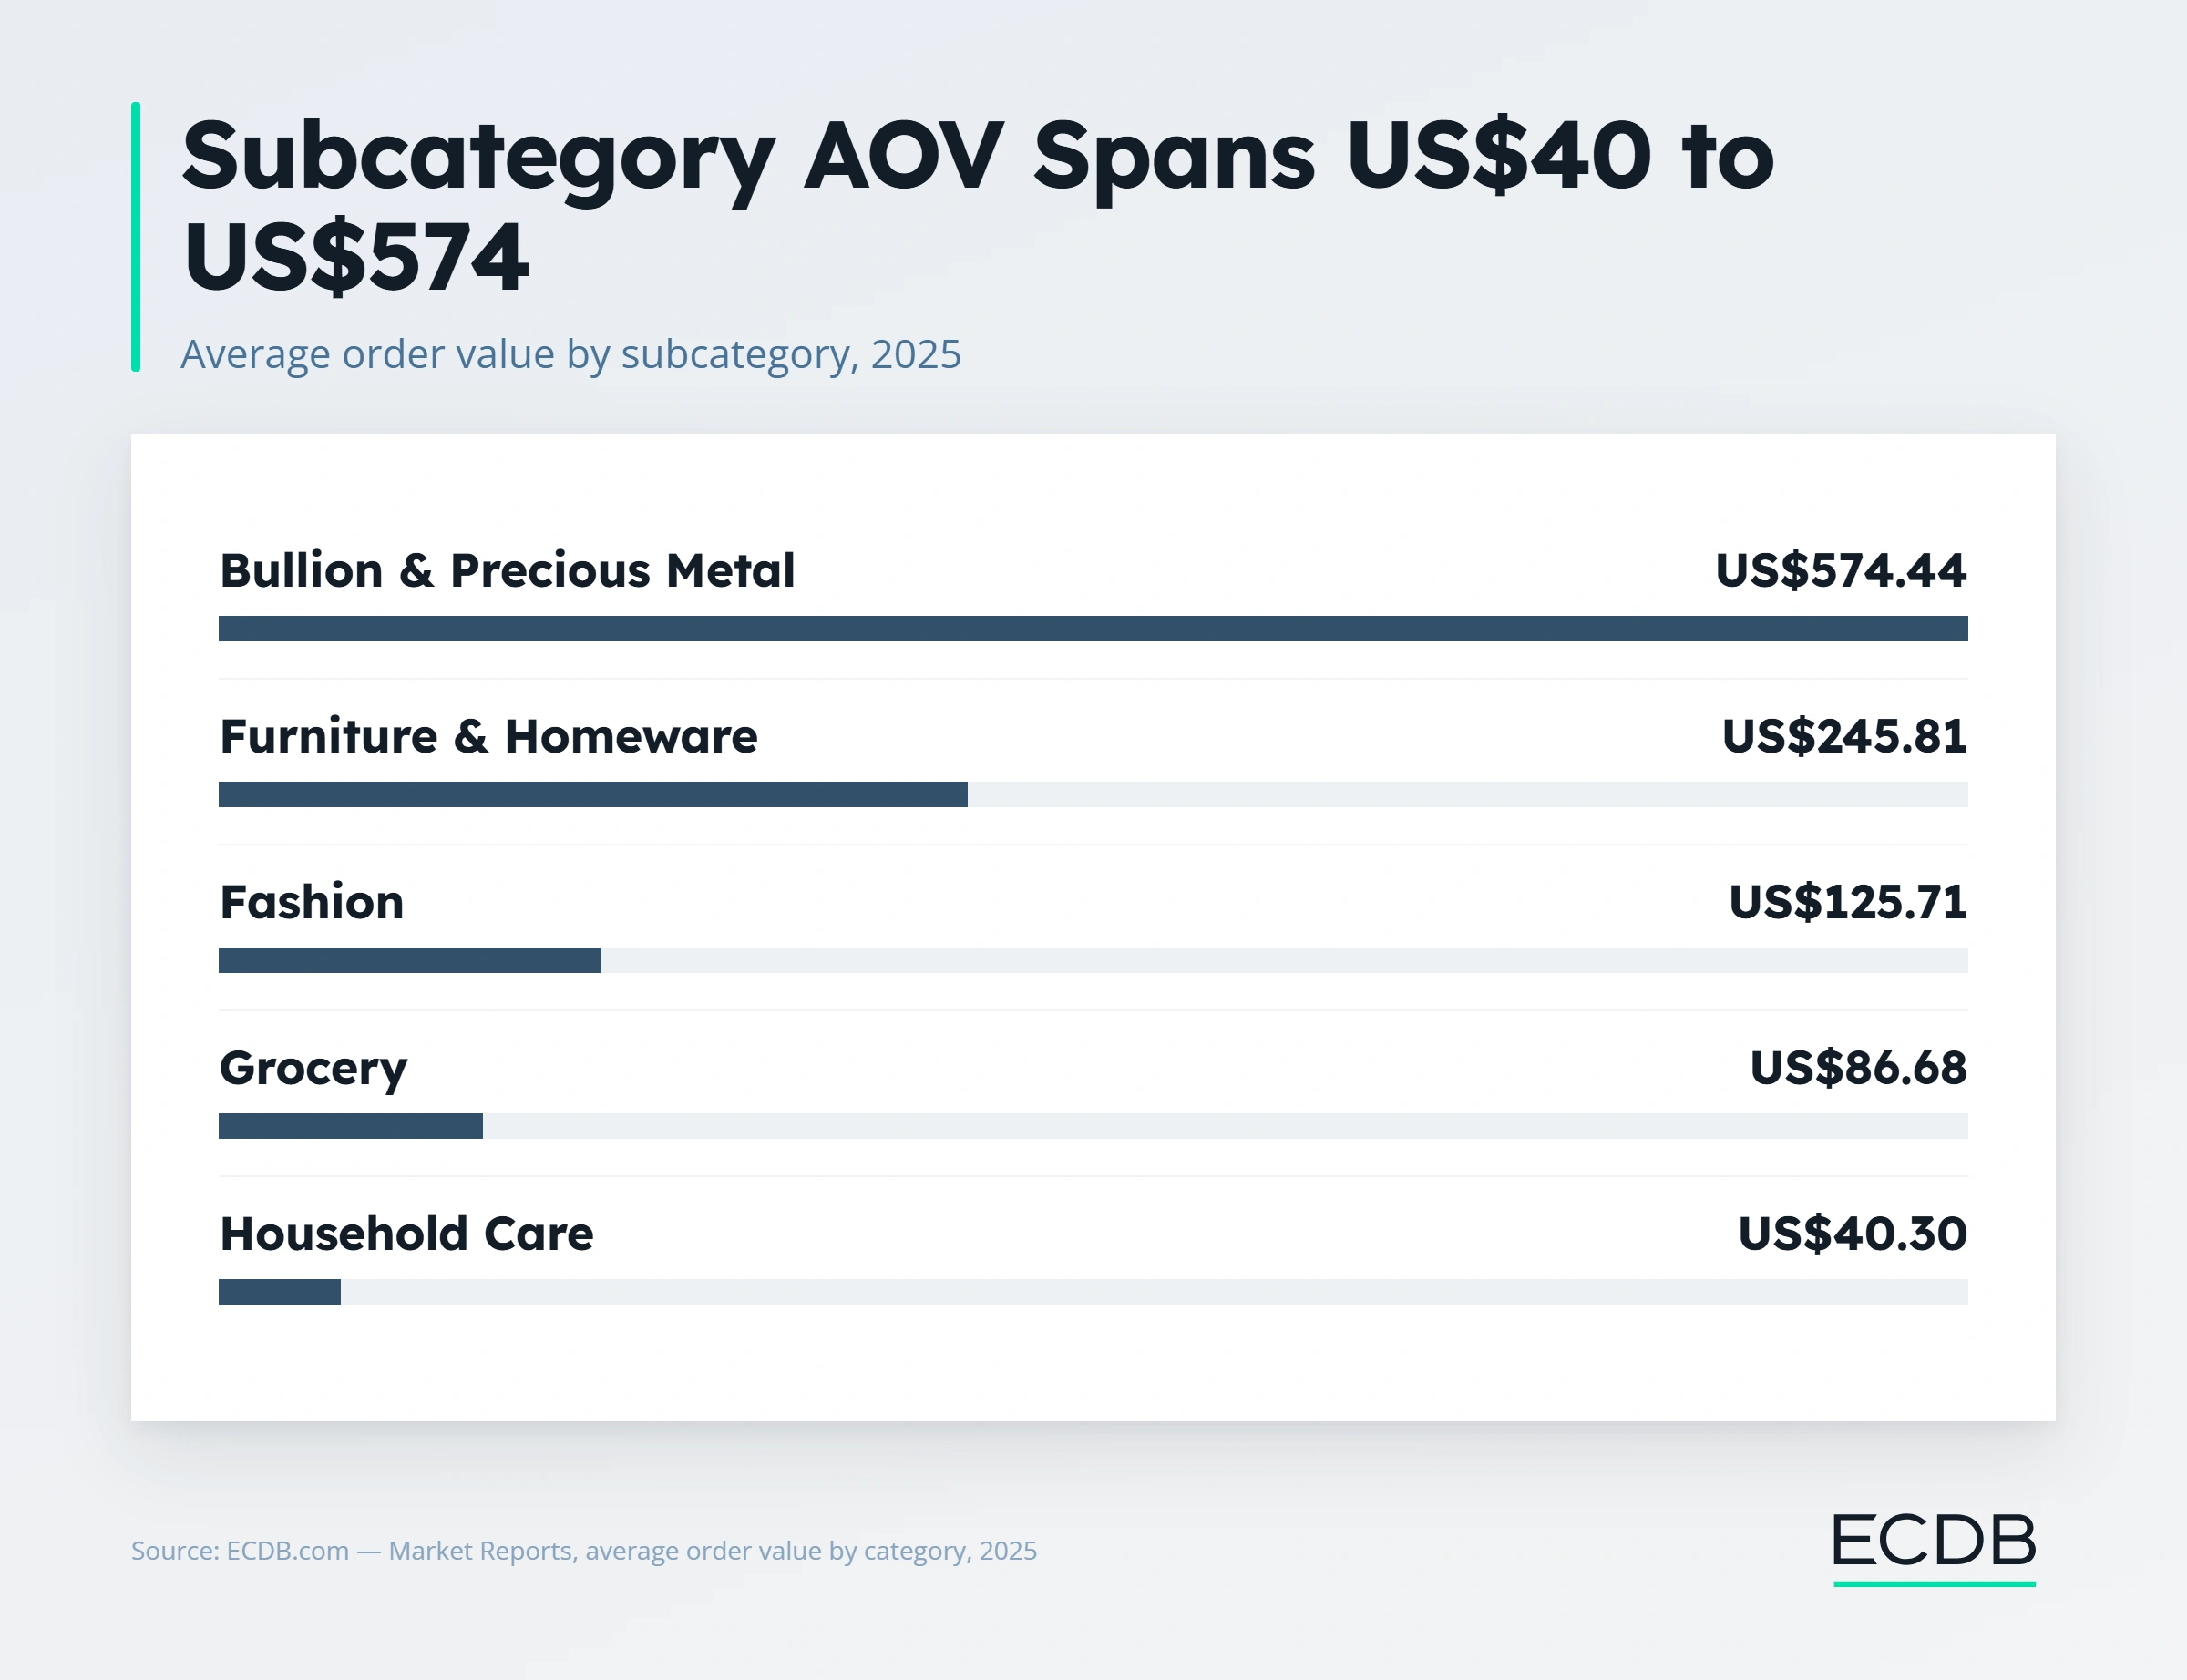
That order tracks purchase behavior directly. Categories bought often and without much thought, cleaning supplies, groceries, price low, because the business model depends on customers coming back constantly rather than spending big any single time.
Categories bought rarely, after real consideration, price high, because there's no repeat-purchase engine to fall back on. Conversion rate moves in the opposite direction for the same reason:
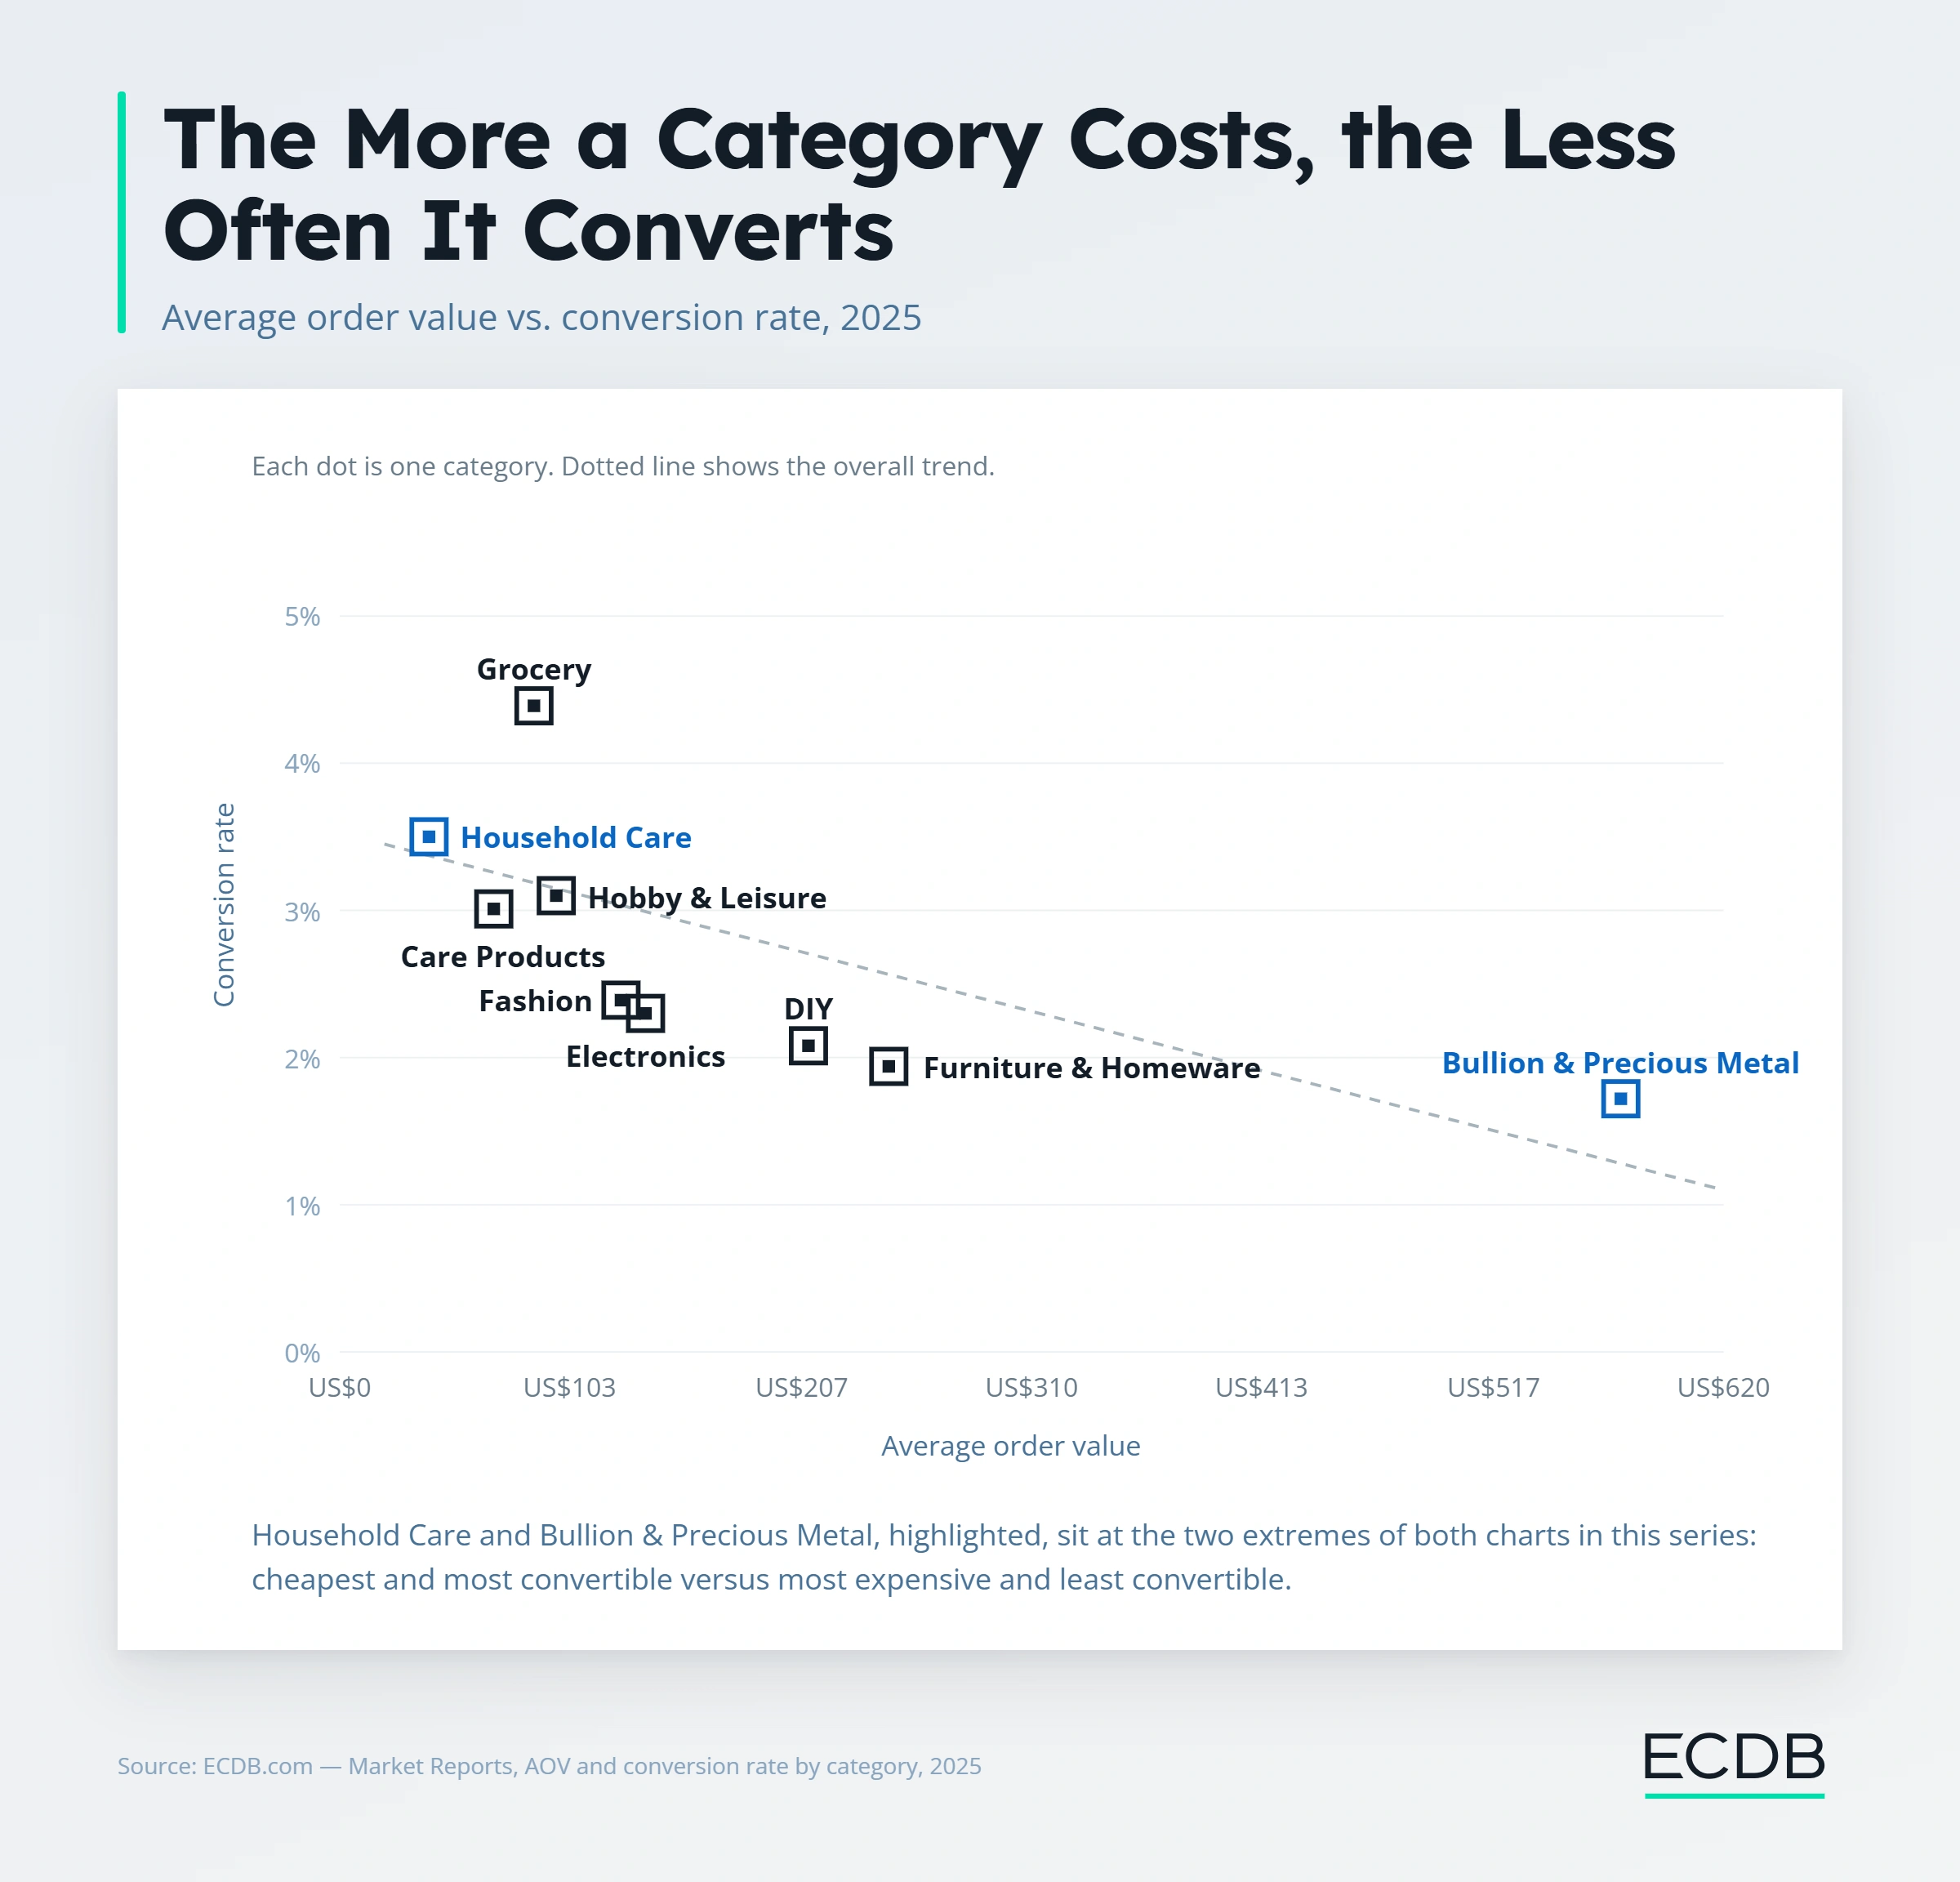
Household Care converts visits into orders at 3.5%, Bullion & Precious Metal at just 1.66%, since a bigger, more deliberated purchase takes longer to commit to.
A bigger basket looks like a win on a dashboard, and it can still be the losing move once frequency enters the picture. Chewy's AOV, US$85.60, beats Amazon's US$72.80. Sephora's AOV, US$75.80, beats it too.
Neither comes close to Amazon's actual value per customer, because Amazon's customers buy 21.95 times a year against 6.91 for Chewy and 2.11 for Sephora.
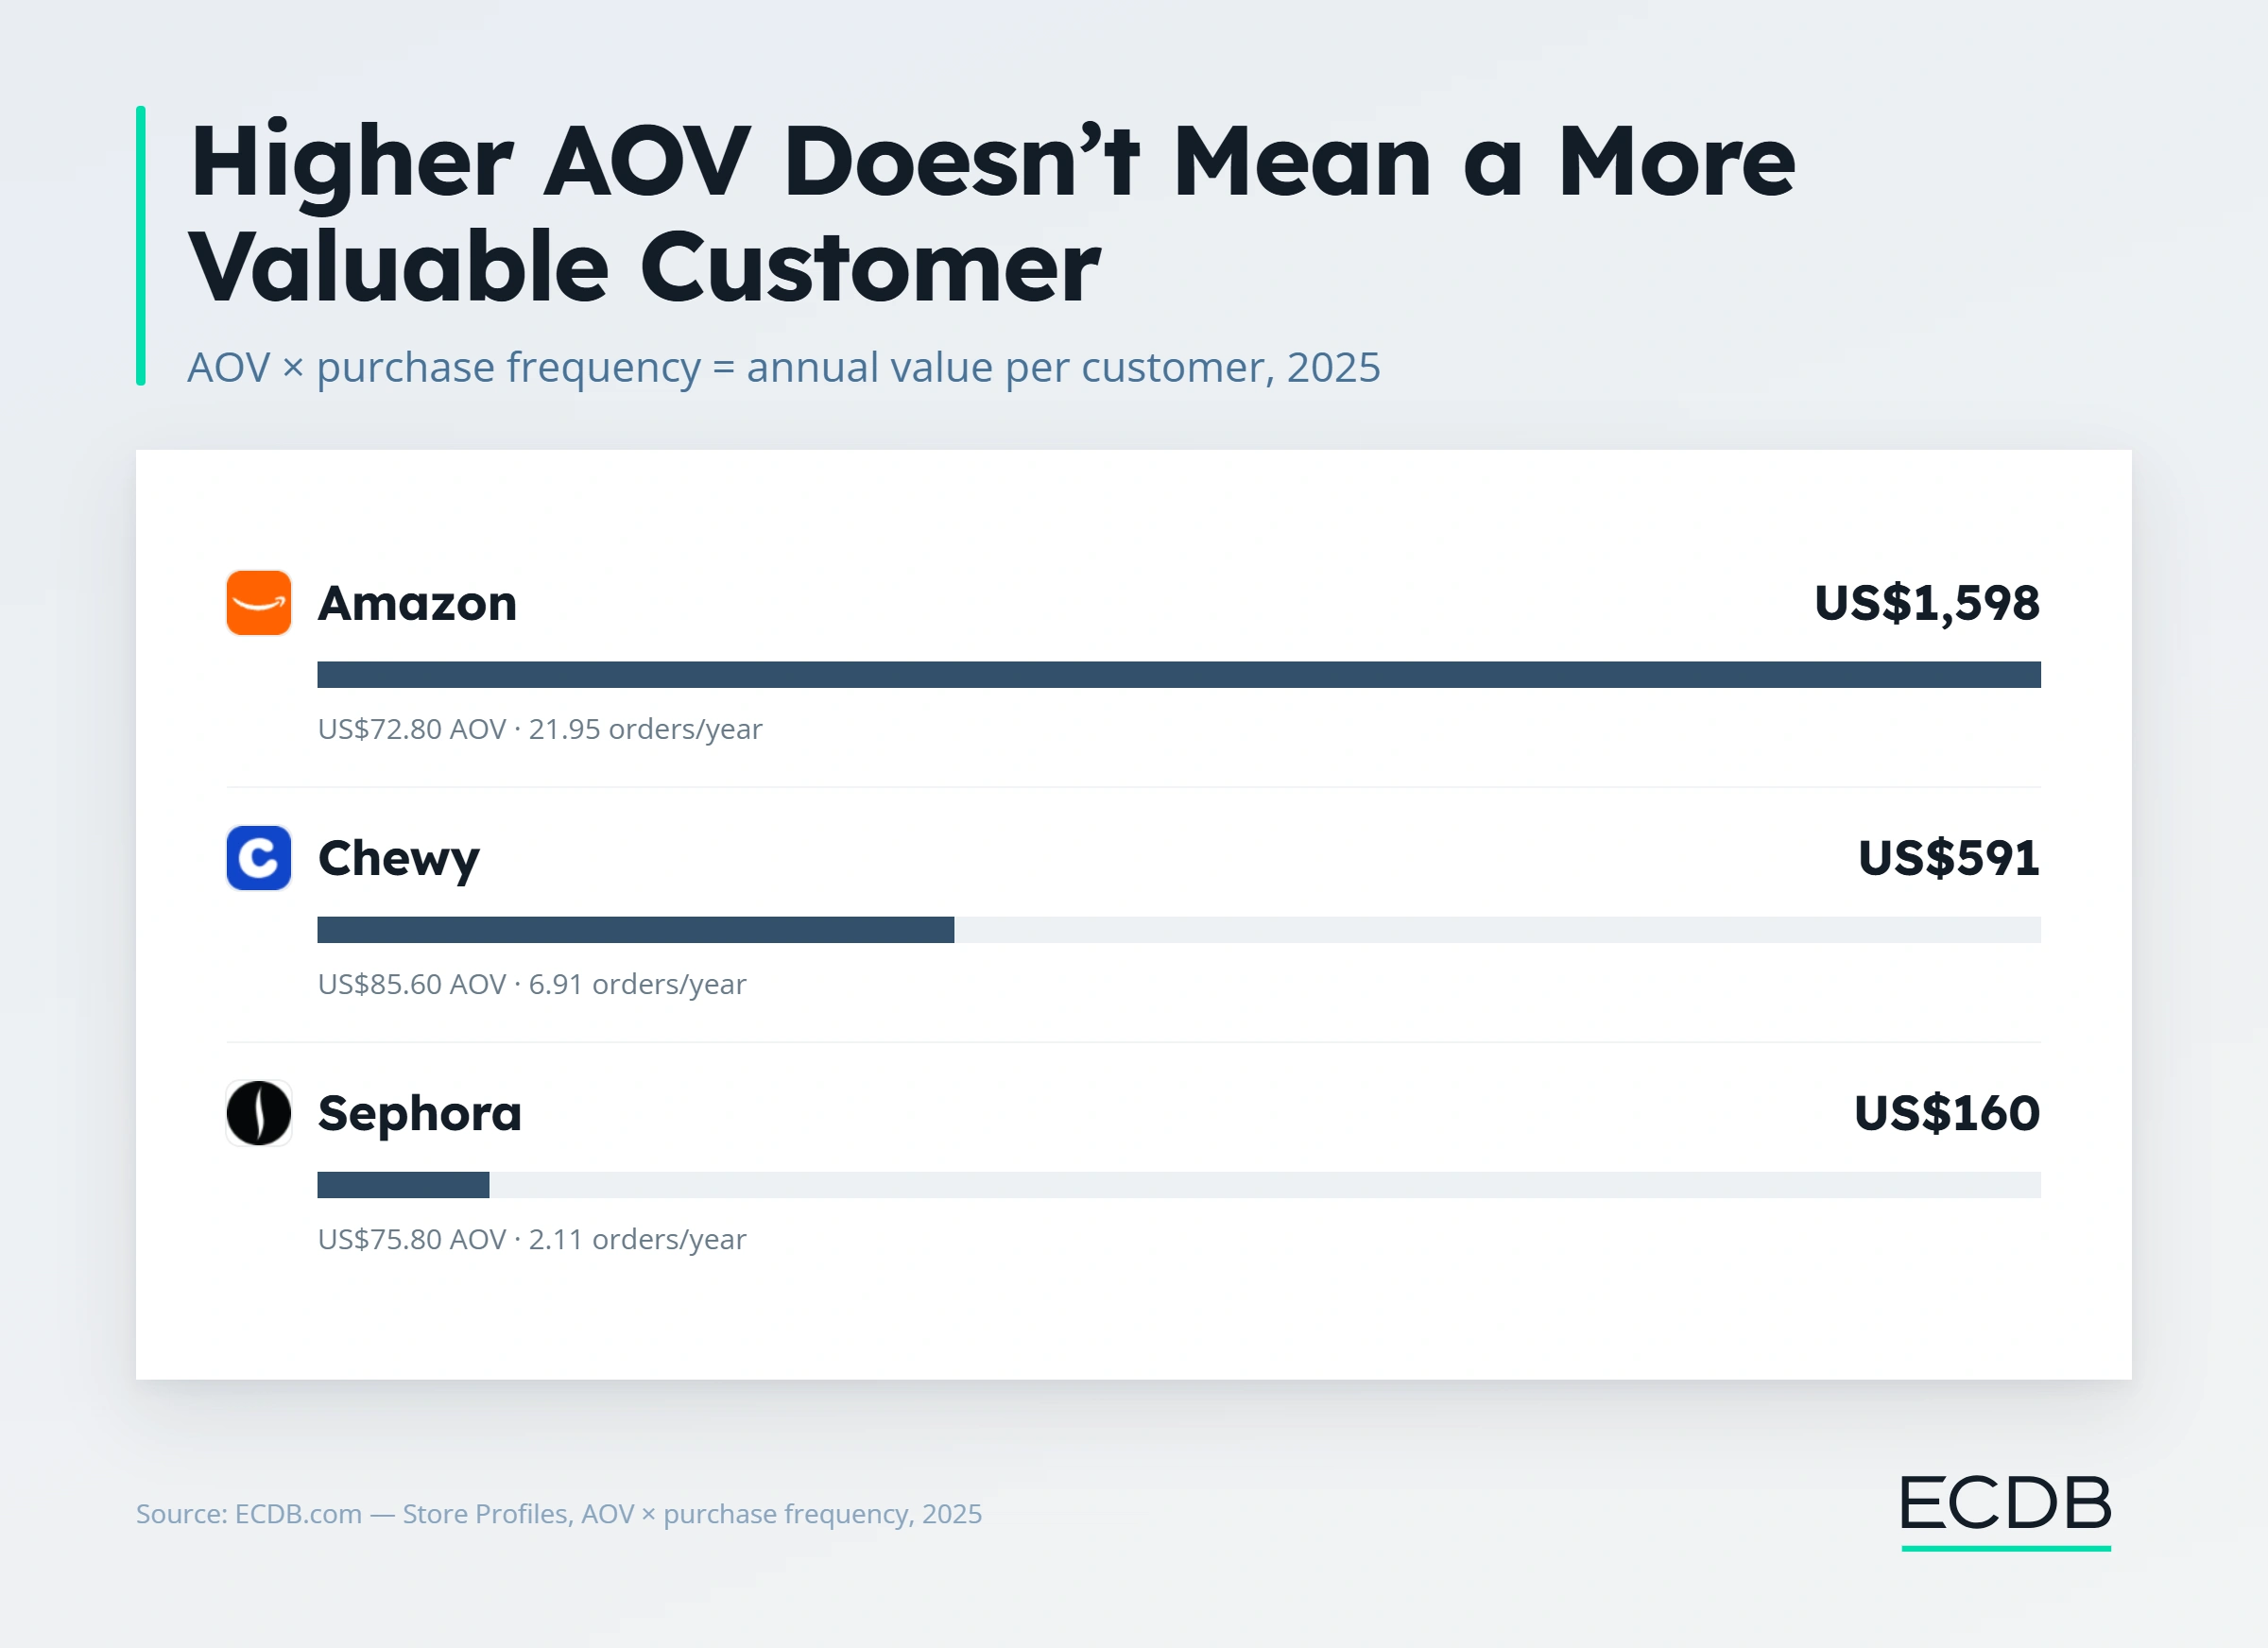
This is the trap a lot of AOV-focused strategies fall into: raising minimum order thresholds, pushing bigger bundles, or nudging customers toward premium tiers can lift AOV while making the purchase feel like more of a commitment, which drags frequency down to compensate. The number that matters is the one AOV feeds into, not AOV in isolation.
There's no universal AOV tactic, because the right move depends on whether a category runs on frequency or on considered, occasional purchases.
For low-AOV, high-frequency categories, household essentials, personal care, groceries, the tactics that work make repeat buying easier and more automatic:
Subscription or auto-replenishment pricing, so the basket grows through convenience rather than persuasion.
Multi-pack bundling on items customers already buy on a cycle.
Free-shipping thresholds set just above the typical basket size, close enough to feel reachable without requiring a real change in buying behavior.
For high-AOV, low-frequency categories, furniture, precious metals, big-ticket electronics, the tactics that work reduce the friction of a single, larger decision instead of trying to manufacture repeat purchases:
Financing or installment options that make a large purchase feel smaller upfront.
Trust signals, reviews, certifications, warranties, placed at the exact point where hesitation is highest.
Premium add-ons tied to the purchase itself, extended warranties, white-glove delivery, rather than volume discounts that don't match how the category gets bought.
Categories in the middle, fashion, general electronics, benefit from a blend: tiered spending incentives, targeted cross-sells at checkout, and enough sizing or fit guidance that a bigger order doesn't turn into a bigger return.
An AOV tactic needs to be judged against conversion rate and purchase frequency, not against AOV alone. Douglas.de makes the point well: it carries the second-highest AOV among its closest competitors, yet Flaconi, with a lower AOV, has been growing more than twice as fast. A higher basket size didn't translate into faster growth, because frequency and acquisition were doing more of the actual work.
Before calling an AOV tactic a success, the same basket size needs to be checked against what happened to conversion rate and repeat purchase behavior over the same period. A tactic that raises AOV while suppressing either one usually isn't a net win, even when the AOV chart alone looks like progress.
Every AOV figure in this article, by category, by subcategory, and by individual retailer, comes from data ECDB tracks across more than 18,000 categories and thousands of stores. That makes it possible to check where a business's own AOV actually sits before deciding whether to push it higher, and what pushing it higher would need to look like given the category's real economics.
In practice, that means using Category Explorer and Analyze & Compare to benchmark AOV against a category's real average rather than a guess, Competitor Finder to make sure the AOV comparison is against a genuine peer and not just the biggest name nearby, and Profiles to see whether a competitor's higher AOV is actually paying off in growth or just looks that way from the outside. Shopper Analytics adds the layer underneath: which customer segments already tolerate a higher basket size, so an AOV push can target the shoppers most likely to respond to it instead of raising thresholds for everyone at once.
Related Articles
Fashion returns get sent back at more than four times the rate of the lowest category. The reason is deeply tied to user behavior.
The United States lead with a purchase frequency of around 28 times in a year. At the same time, almost 1 in 3 US retail dollars is made online. Here is why.
Austrian and German online shoppers purchase most frequently in a year, while other markets reveal different purchasing habits. Greece is one of the cases where frequency does not match revenue. Here are the specifics.

Click here for
more relevant insights from
our partner Mastercard.
Book a demo to see how ECDB's market intelligence can support your business.