E-Commerce Pricing Strategy: How Wide Is the Price Spread by Category?
Retailers looking to increase sales have to look at their prices first. Each category has its own ideal price range, and that's what this article maps out.

Article in a Nutshell
Average order value ranges from US$68.69 in Care Products to US$245.81 in Furniture & Homeware across the seven top-level categories ECDB tracks, a 3.6x spread.
The real extremes hide inside those categories: Household Care averages US$40.30 while Bullion & Precious Metal averages US$574.44, a 14x gap, even though both sit under a larger parent category.
That gap tracks how a category actually gets bought. Categories built on frequent, low-commitment purchases price low. Categories built on rare, considered purchases price high.
How wide is the price spread by category? Wide enough that a single average order value tells almost nothing on its own. Across the seven top-level categories, the spread is already 3.6x. Look one level deeper, at the specific subcategories inside them, and the spread widens to 14x.
Both numbers matter for pricing strategy, but the second one is the one most brands miss, because it's easy to check a category's average and assume that number applies evenly to everything inside it.
The Spread Across the Seven Top-Level Categories
Average order value varies by more than three and a half times across the seven categories ECDB tracks at the top level:
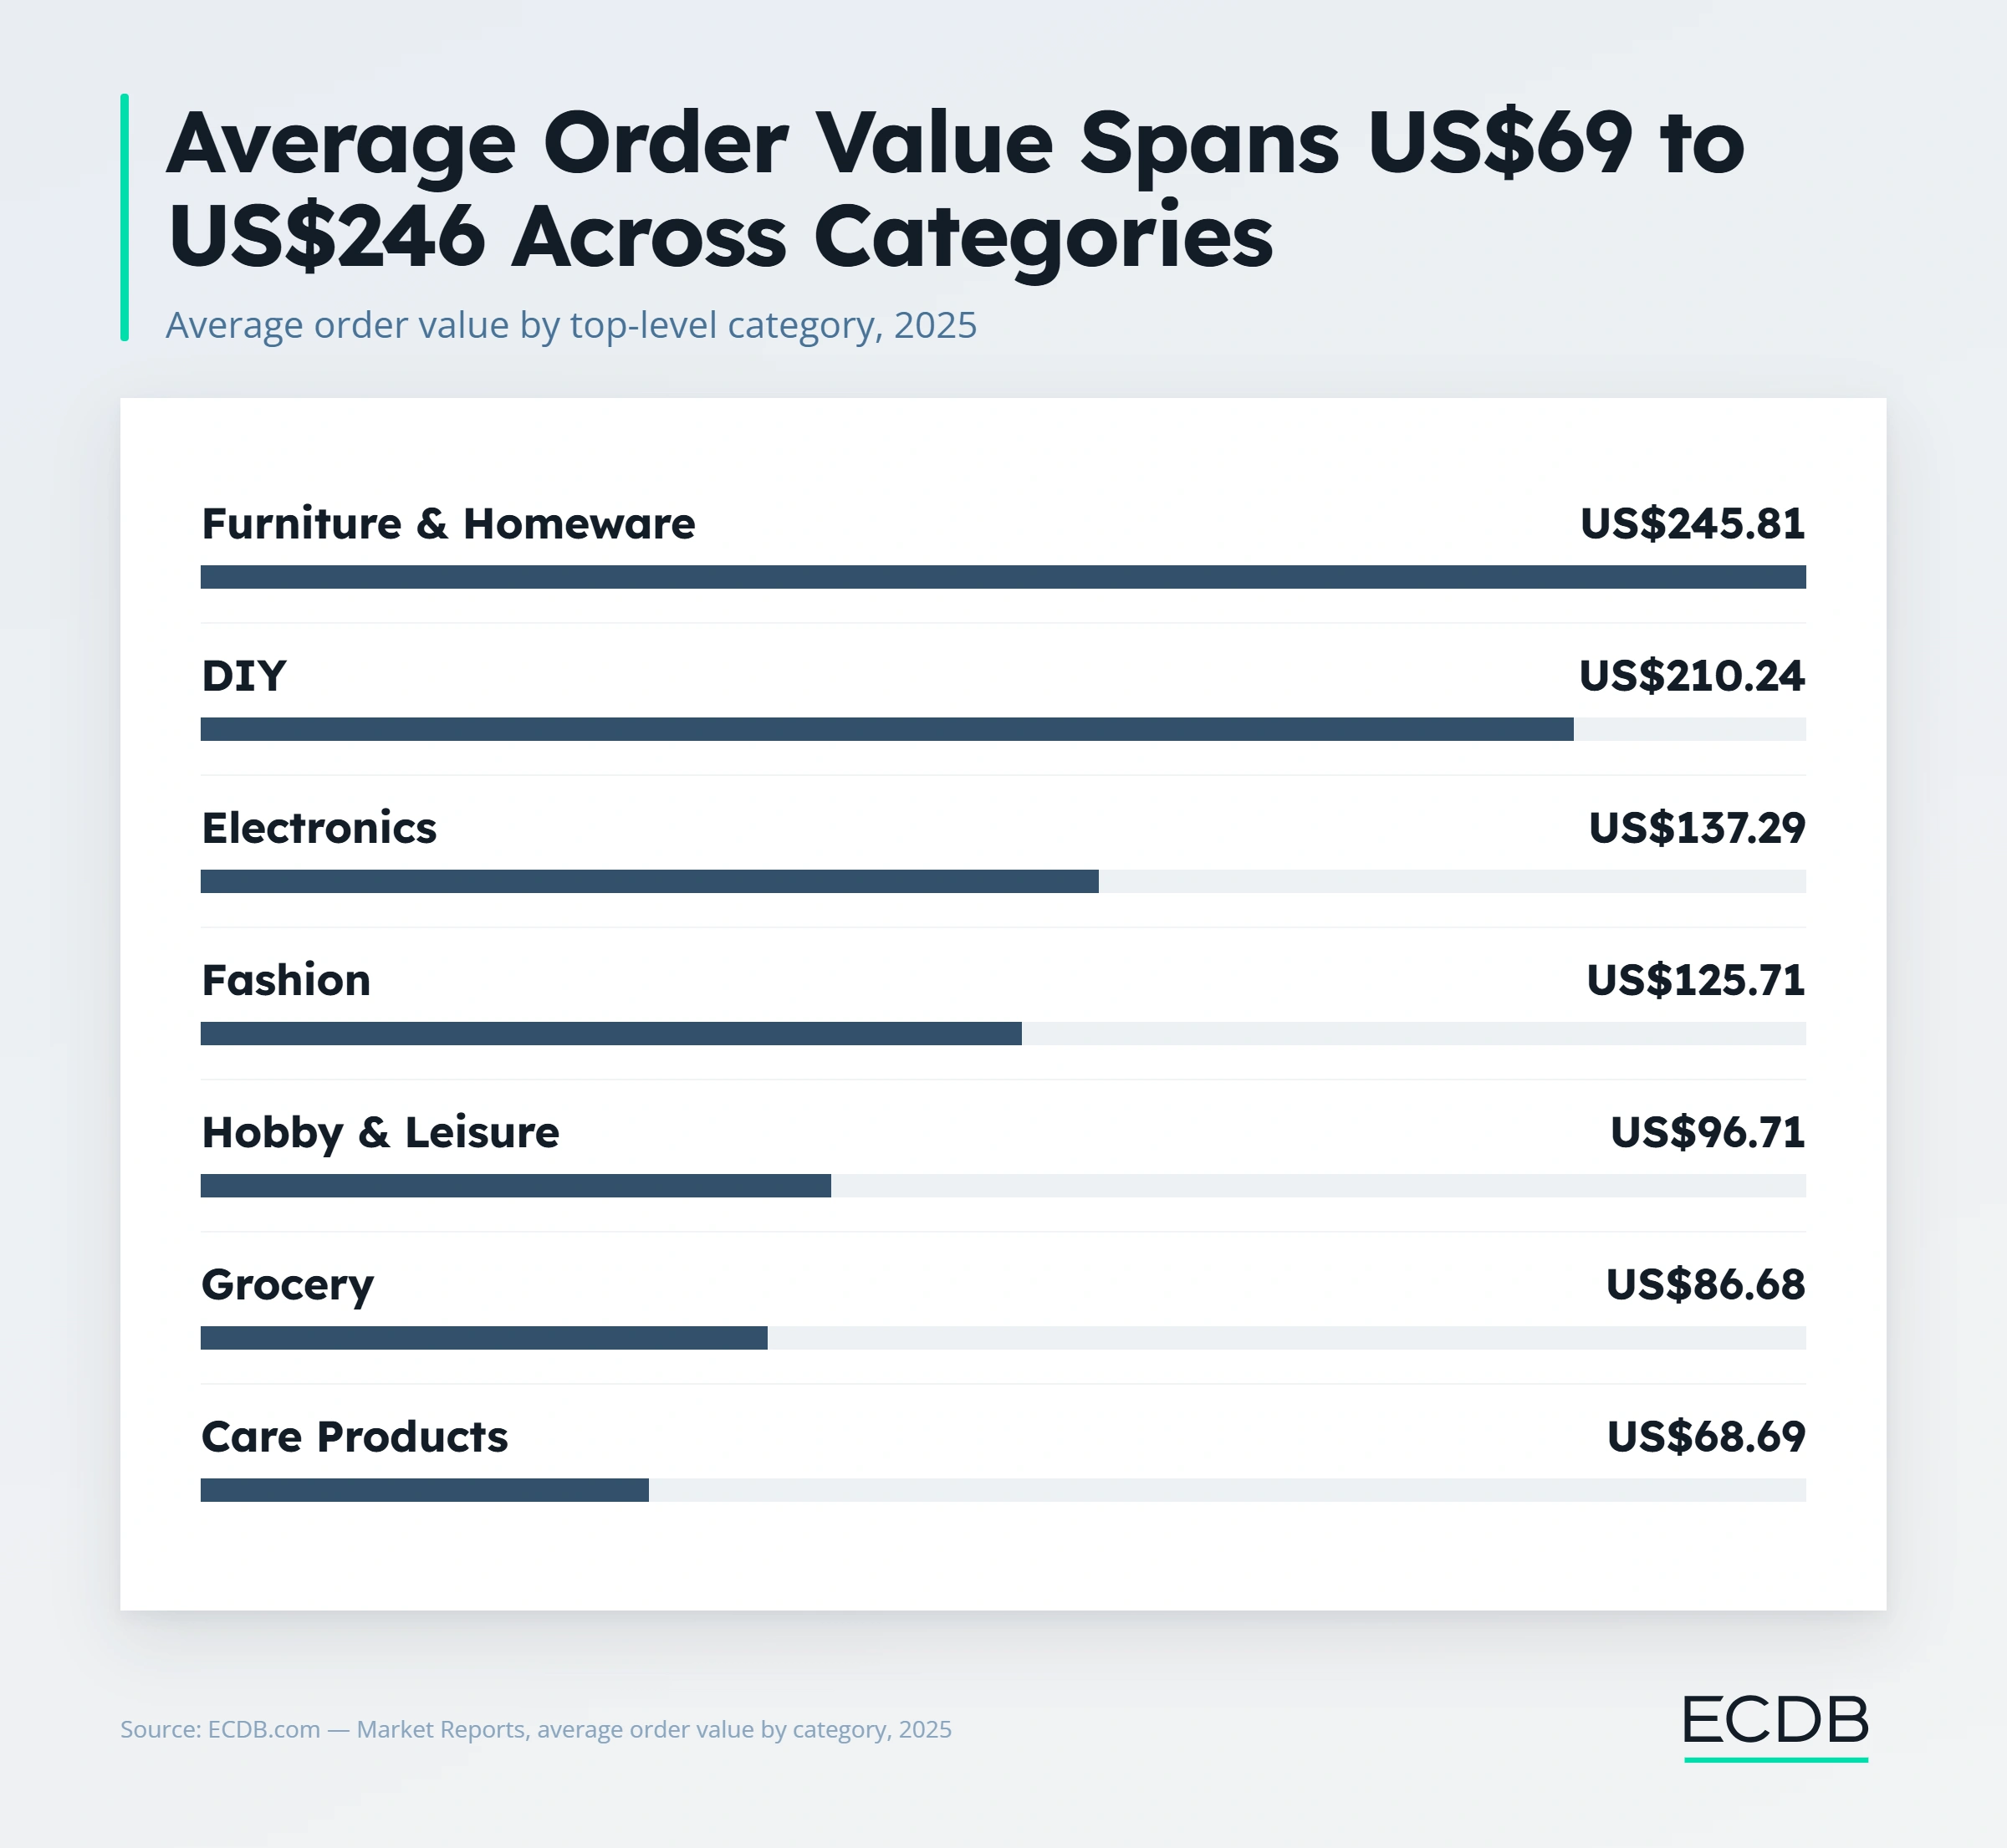
Care Products: US$68.69
Grocery: US$86.68
Hobby & Leisure: US$96.71
Fashion: US$125.71
Electronics: US$137.29
DIY: US$210.24
Furniture & Homeware: US$245.81
The pattern lines up with how often and how casually people buy in each category. Care Products and Grocery sit at the bottom because they're bought often and replaced quickly.
Furniture & Homeware and DIY sit at the top because a single purchase, a sofa, a power tool, tends to replace a whole category of future purchases at once. Fashion and Electronics land in the middle, bought more deliberately than groceries but far more often than furniture.
The Real Extremes Are Hiding Inside These Categories
The top-level numbers understate how wide the spread actually gets. Household Care, a subcategory of Care Products, averages US$40.30, well below even Care Products' own US$68.69 average. Bullion & Precious Metal, a subcategory of Hobby & Leisure, averages JUS$574.44, nearly six times above Hobby & Leisure's own US$96.71 average.
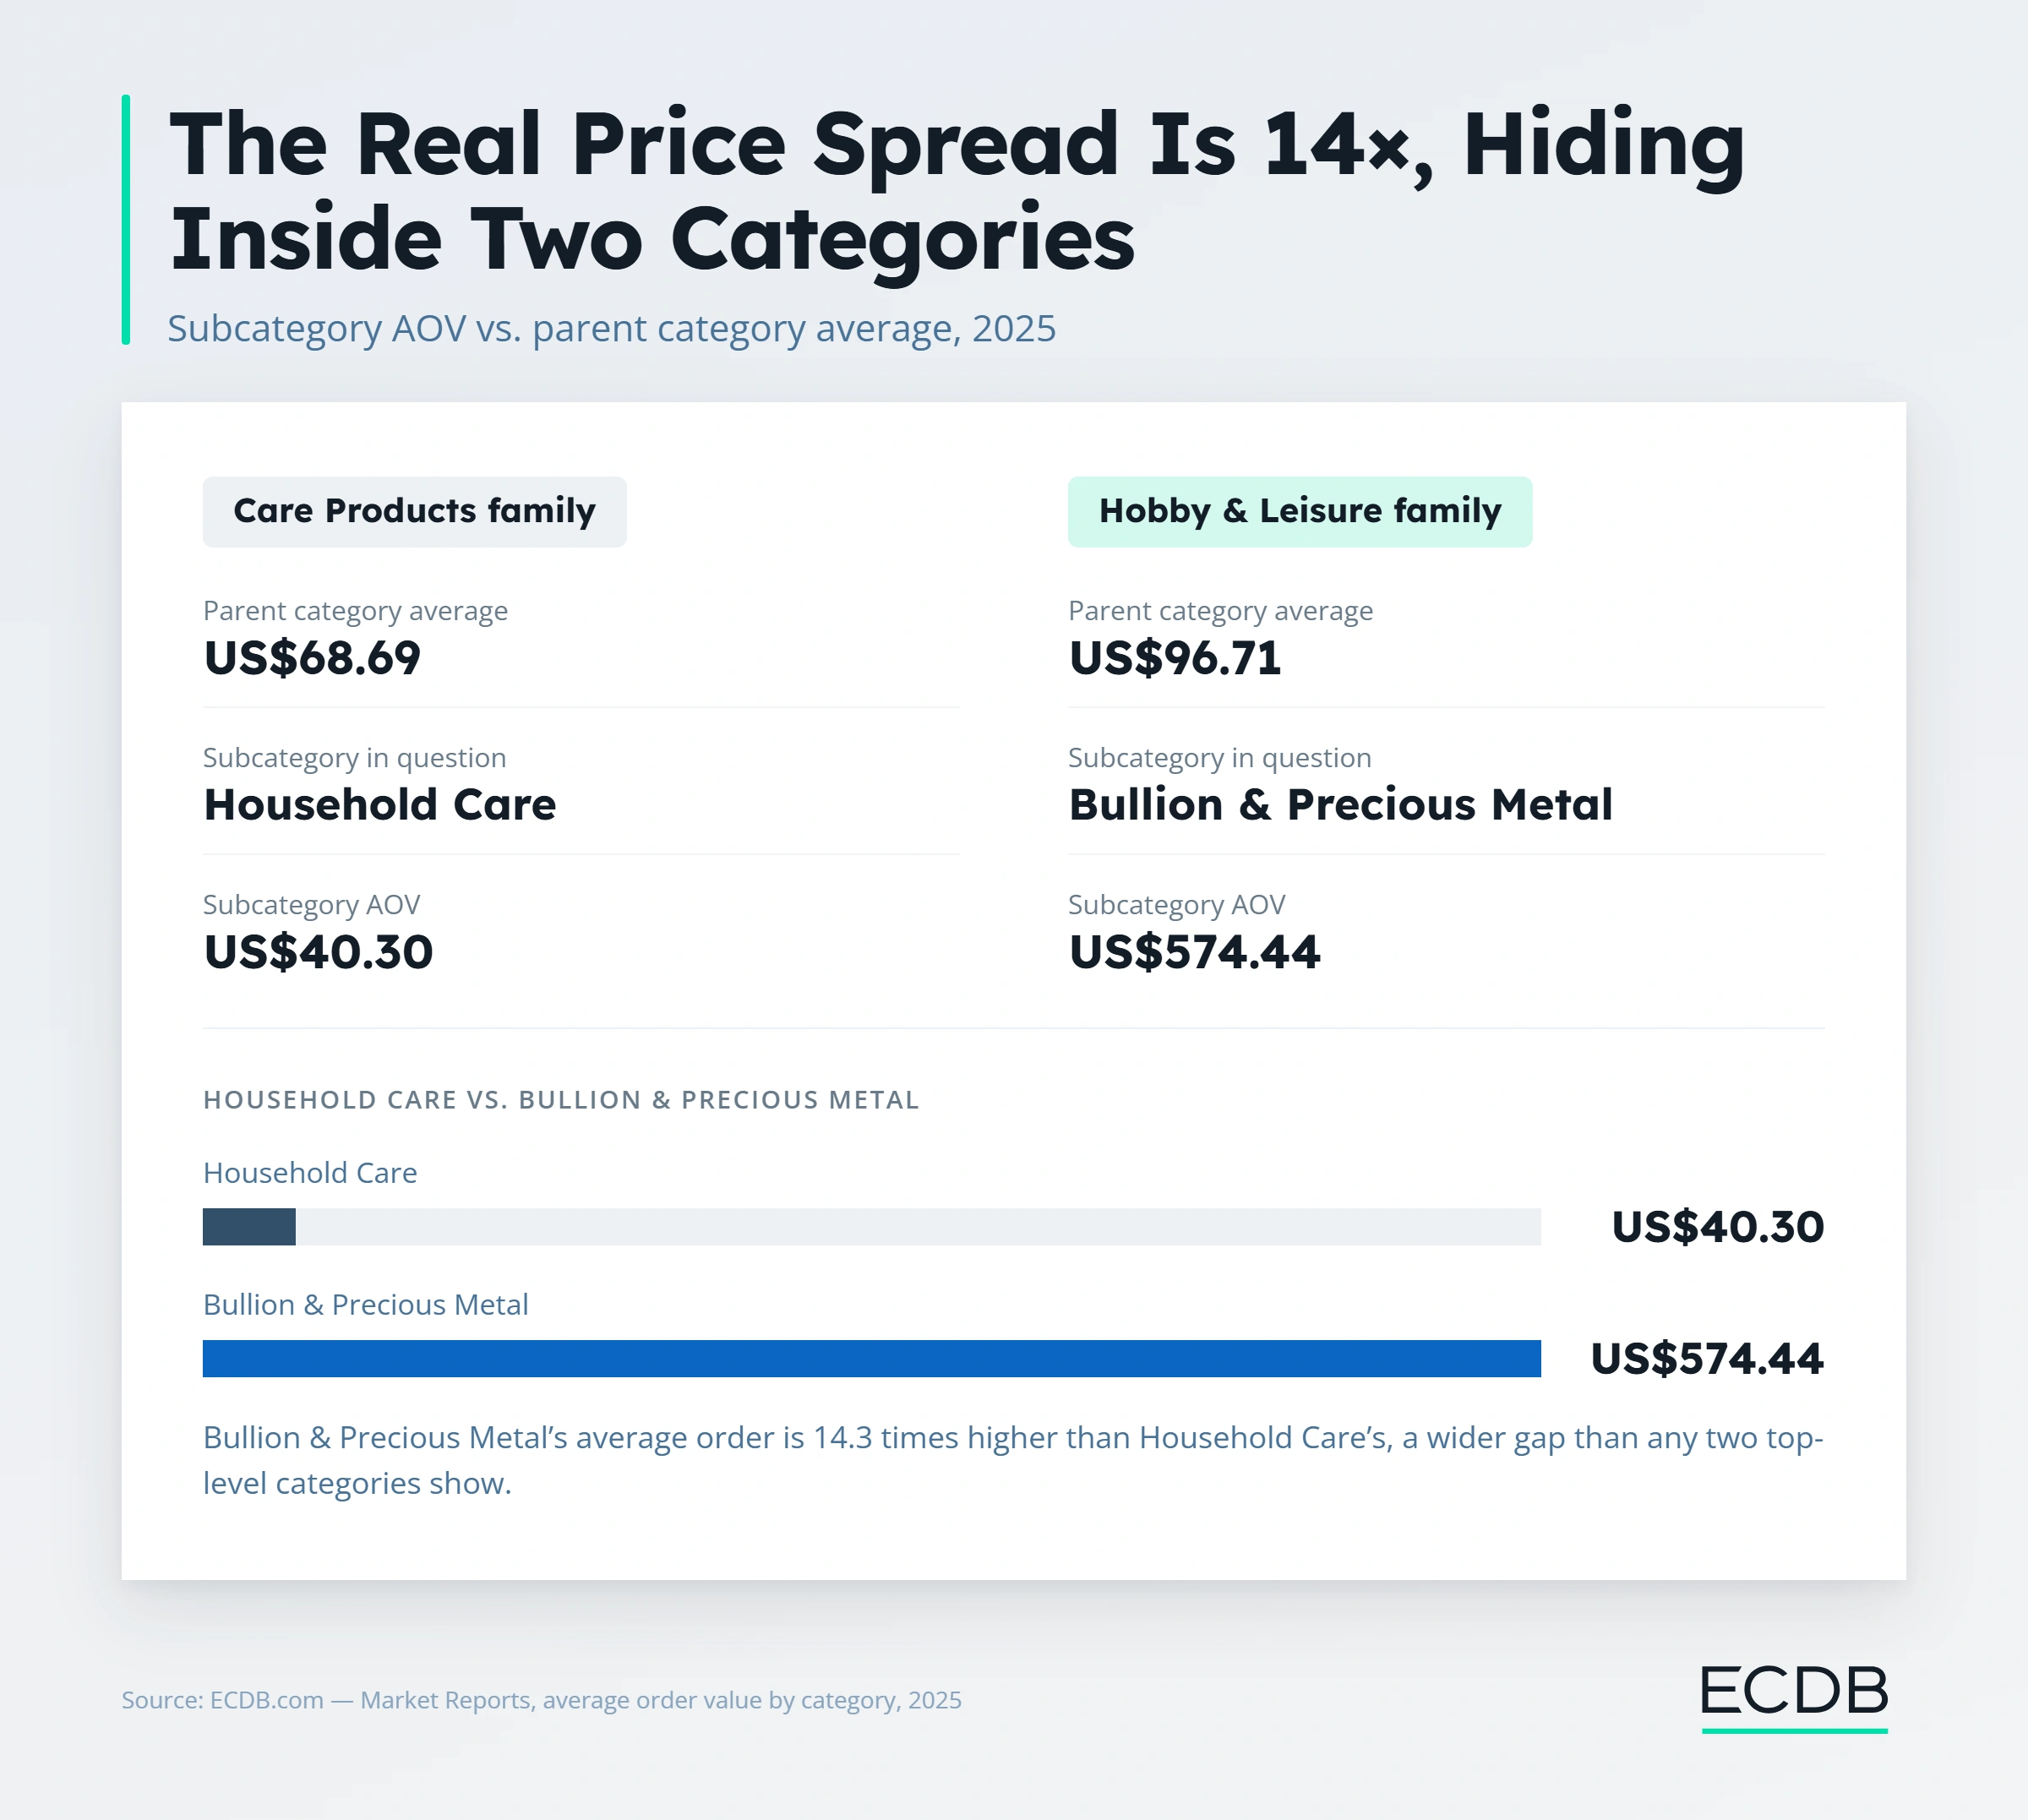
Put those two subcategories side by side and the spread jumps to 14x, four times wider than the gap between the cheapest and most expensive top-level category. A brand that prices off the top-level average for its category can still be pricing blind, since the specific subcategory it competes in might sit nowhere near that number.
Why the Spread Exists: Purchase Behavior, Not Product Value
The gap essentially tracks how often and how deliberately customers buy in each category.
Household Care runs on repeat purchases, restocking cleaning supplies is routine and low-stakes, so the category prices low and counts on customers coming back often.
Bullion & Precious Metal runs on the opposite logic: customers buy rarely, need to trust the seller, and are making a considered financial decision each time, so the category prices high and doesn't depend on frequent repeat purchases to work.
The same pattern shows up at the brand level. MeUndies prices its subscription underwear at a $35.70 average order, a low-ticket price point built around a recurring, low-stakes purchase people don't think twice about.
Casper prices its mattresses at $588.00, a considered purchase customers research for weeks and buy maybe once every several years. Neither price point is a mistake. Each matches how that specific product actually gets chosen.
What This Means for Setting a Price
Three checks separate a price grounded in real category behavior from one that's just a guess dressed up as a strategy:
Check the specific subcategory's average order value, not just the top-level category it sits under. A furniture accessory and a full sofa both count as Furniture & Homeware, but they don't share a price point.
Check whether the category rewards frequency or rewards a considered, less frequent purchase. That answer decides whether the business model should lean on subscriptions and repeat buying, or on trust, credibility, and a strong case for the one-time purchase.
Check where a specific brand sits relative to others in the same subcategory, not against a category the brand only loosely resembles. Pricing a new skincare brand against Apparel's average or a new furniture brand against Grocery's average measures it against the wrong game entirely.
How ECDB Grounds a Pricing Decision in Real Data
Every AOV figure in this article, at the top-level category and the subcategory underneath it, comes from data ECDB tracks across more than 18,000 categories and thousands of stores. That makes it possible to check exactly where a specific product sits before a price ever gets set, rather than pricing off a competitor that might be playing an entirely different game.
Brands use this to price new products against the subcategory that actually matches how they'll be bought, to catch when a category's top-level average is hiding a much wider spread underneath it, and to benchmark a specific brand's price point against others competing in the same narrow subcategory rather than the same broad label.
That data is available through ECDB's Category Explorer and Rankings tools for any category or subcategory worth pricing against.
Related Articles
All ArticlesReady to Unlock the Full Power of ECDB?
Book a demo to see how ECDB's market intelligence can support your business.