E-Commerce Return Rate by Category: Which Products Get Sent Back Most?
Fashion returns get sent back at more than four times the rate of the lowest category. The reason is deeply tied to user behavior.

Article in a Nutshell:
Fashion has the highest return rate of any category at 19.14%, more than double DIY and Electronics, and more than four times Hobby & Leisure's 4.51%.
Inside Fashion, Apparel alone returns at 24.22%, well above Footwear's 16.0% and Bags & Accessories' 12.91%. The categories where fit is hardest to judge from a photo return the most.
The same category returns differently depending on the country: US shoppers return 31.18% of apparel orders, against 23.75% in Germany and 23.77% in the UK.
Which products get sent back most? Fashion, by a wide margin, and specifically the parts of fashion where a customer can't know for certain how something fits until it arrives.
Every category on this list has its own baseline return rate, and the categories at the top share one thing in common: uncertainty that only gets resolved after the order arrives.
The Return Rate Ranking Across Categories
Return rate varies by more than four times across the categories ECDB tracks at the top level:
Fashion: 19.14%
DIY: 9.4%
Electronics: 9.04%
Grocery: 6.66%
Care Products: 5.57%
Furniture & Homeware: 5.18%
Hobby & Leisure: 4.51%
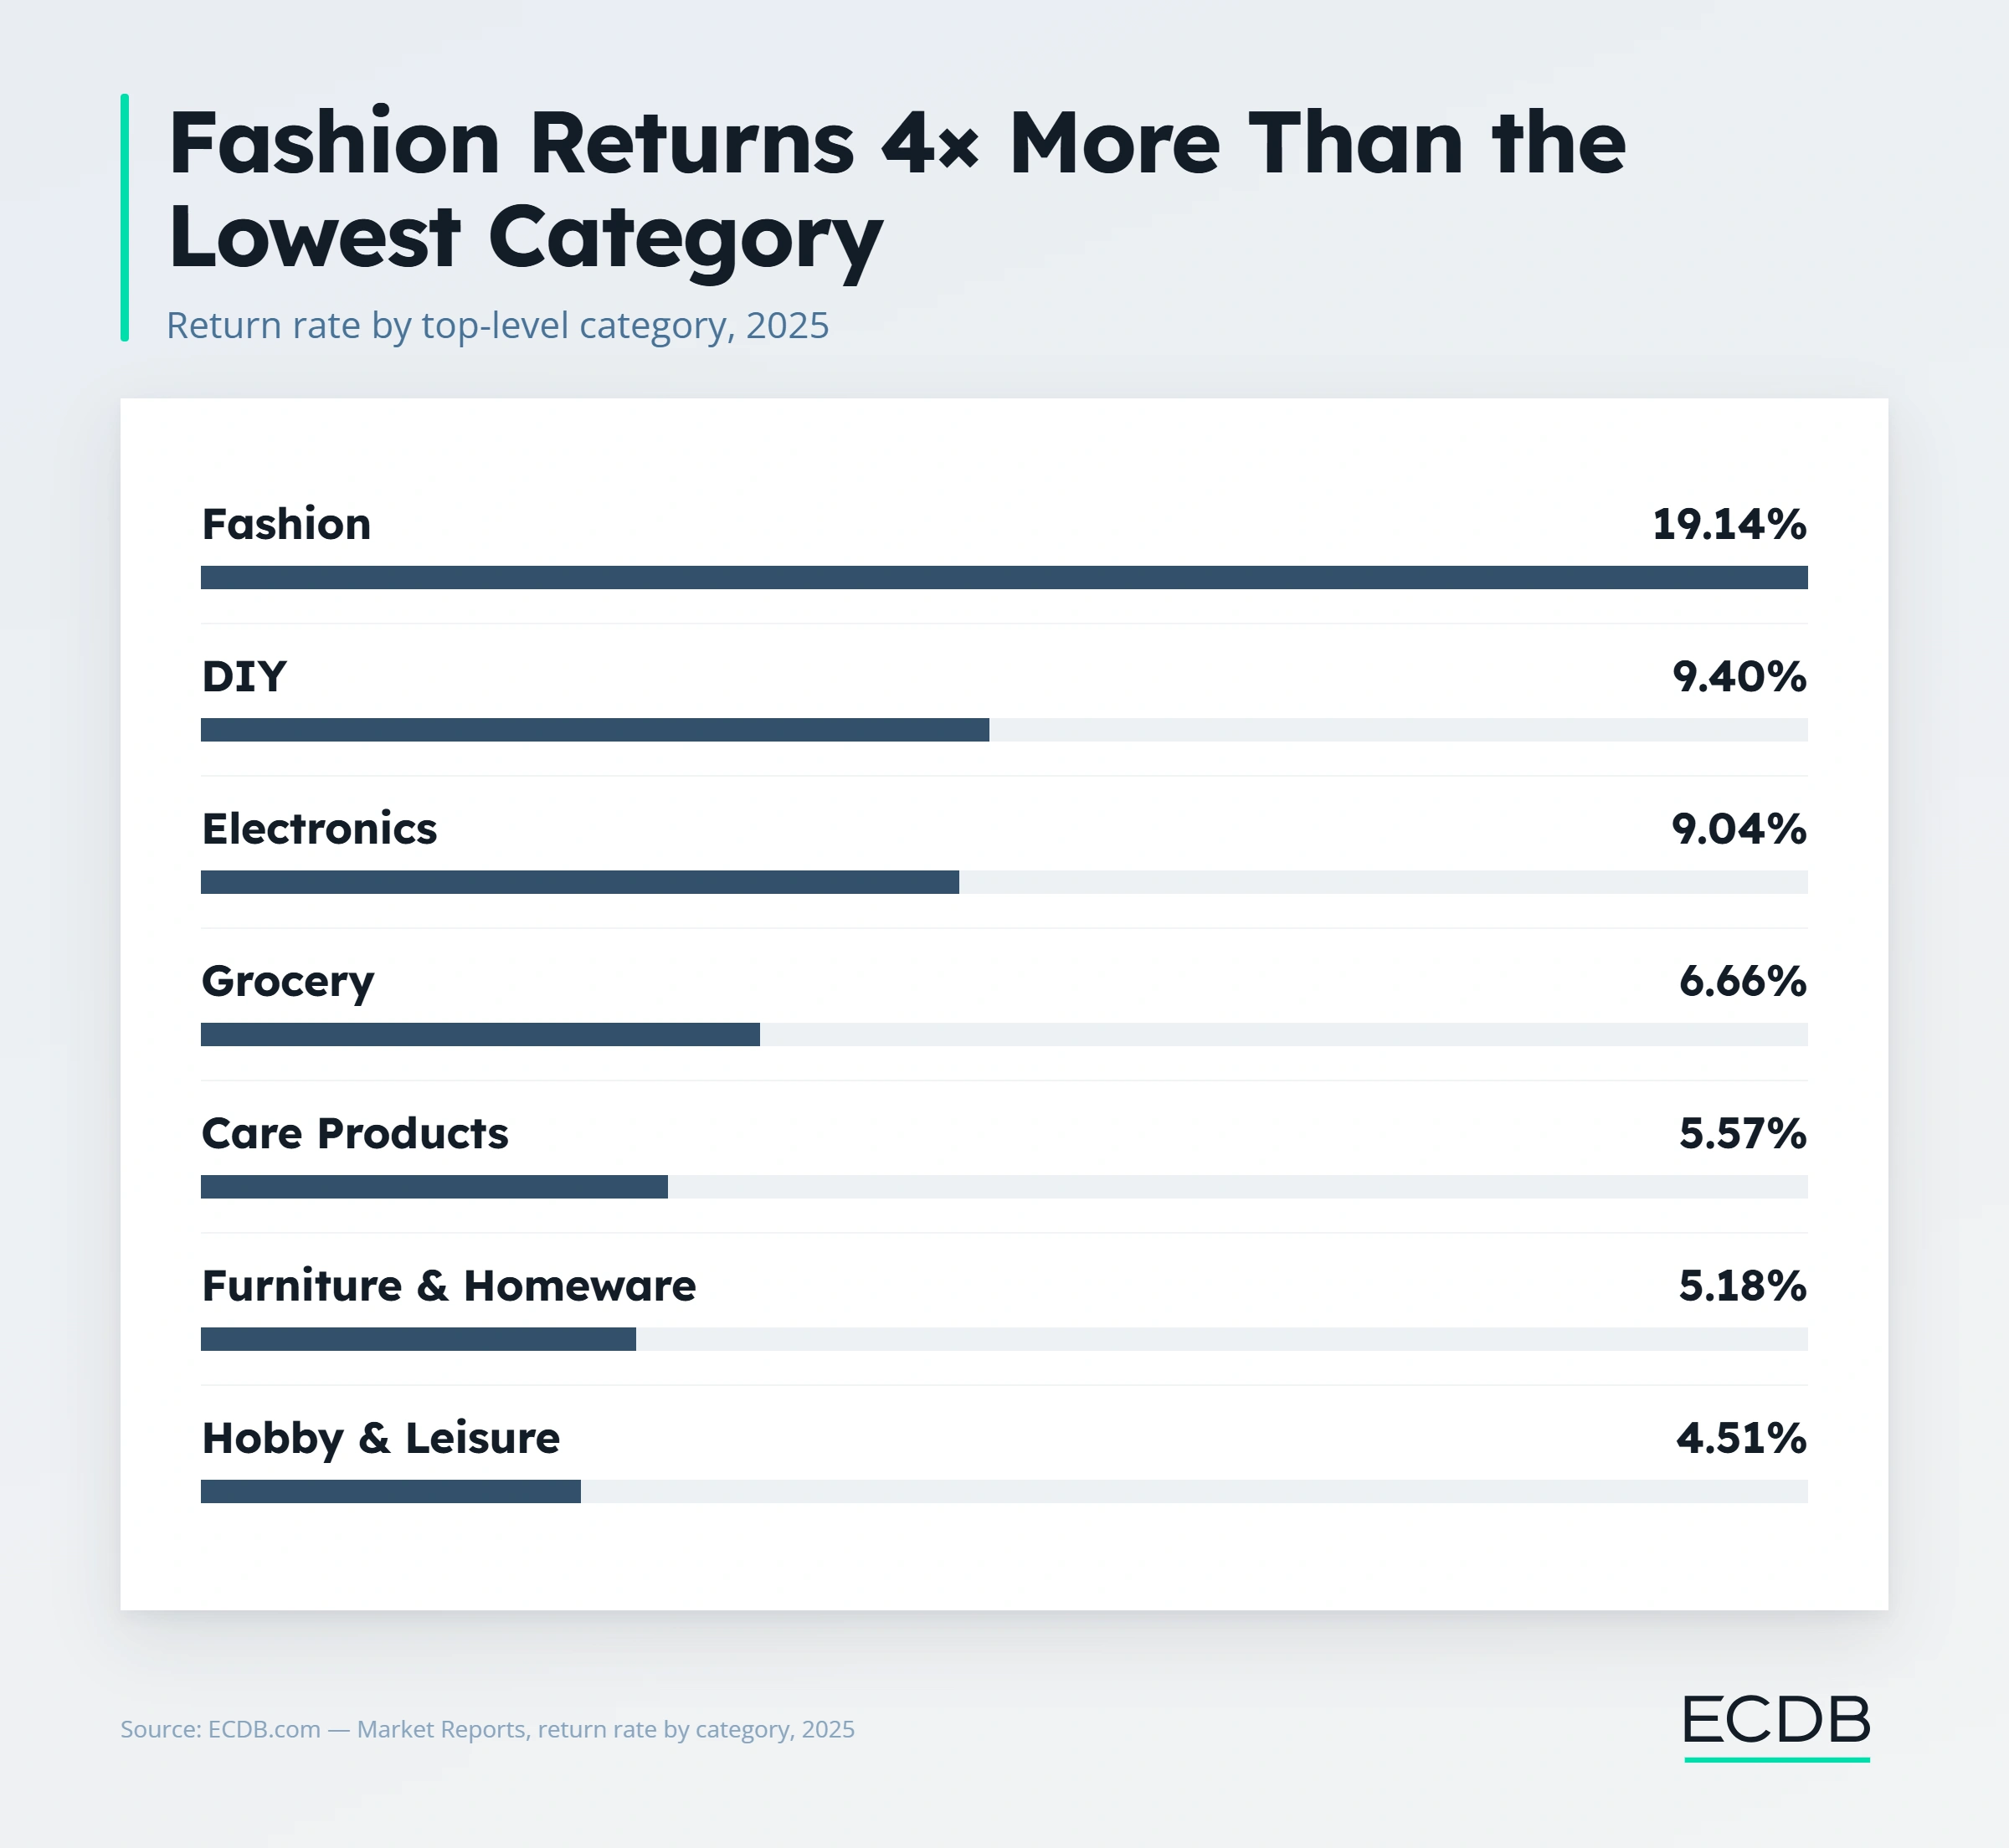
Fashion sits in a different tier entirely, not just at the top of the list. The gap between Fashion and DIY, the second-highest category, is bigger than the gap between DIY and Hobby & Leisure, the lowest. Nothing else on this list comes close to fashion's return problem.
Why Fashion Returns So Much More Than Everything Else
The categories inside Fashion make the mechanism obvious. Apparel returns at 24.22%, the highest of any subcategory checked here. Footwear returns at 16.0%. Bags & Accessories, the least fit-dependent of the three, returns at 12.91%, still elevated compared to most other categories but noticeably lower than clothing or shoes.
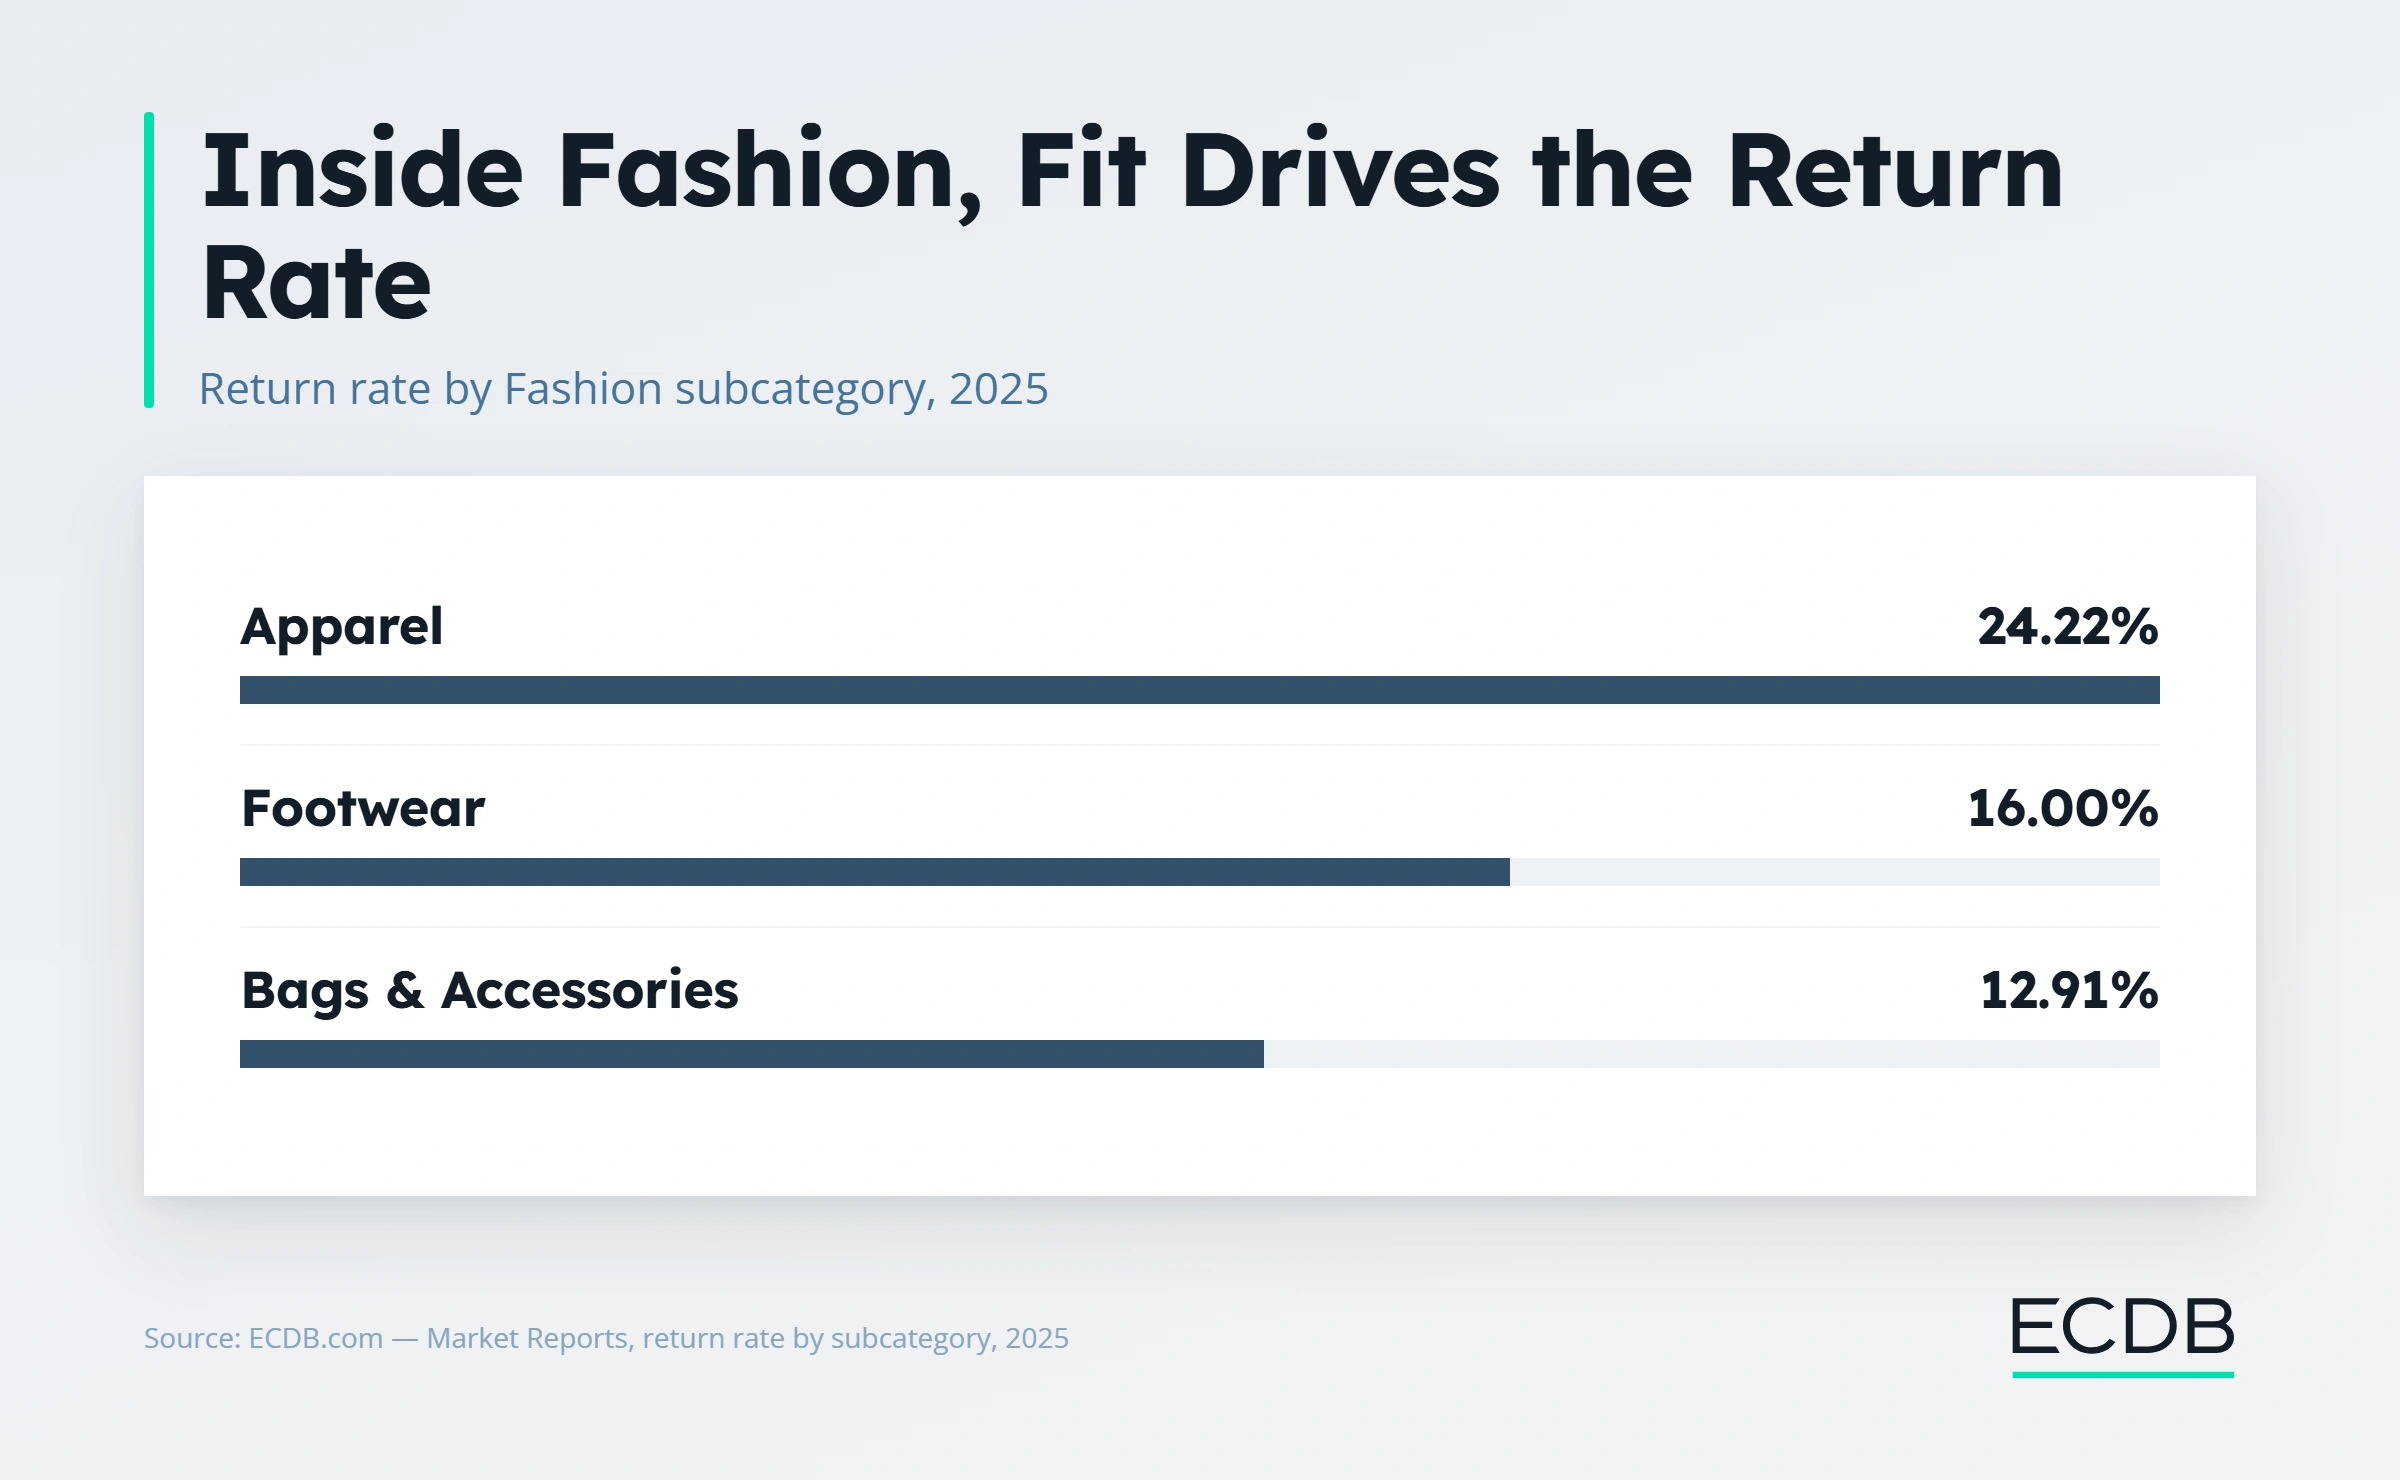
All three share the same root cause: a customer can't confirm fit before the order arrives, and sizing itself isn't standardized between brands, so the same labeled size can fit differently depending on where it was bought.
Some of that return volume is a deliberate strategy known as bracketing rather than a mistake, ordering multiple sizes or colors with the plan to return whatever doesn't work. A generous return policy makes that easy to do and hard to discourage.
Returns Vary by Country, Not Just Category
The same category returns at meaningfully different rates depending on where it's sold. US shoppers return 31.18% of apparel orders, well above the global apparel average of 24.22%. German shoppers return 23.75%, and UK shoppers 23.77%, both close to the global figure and well below the US number.
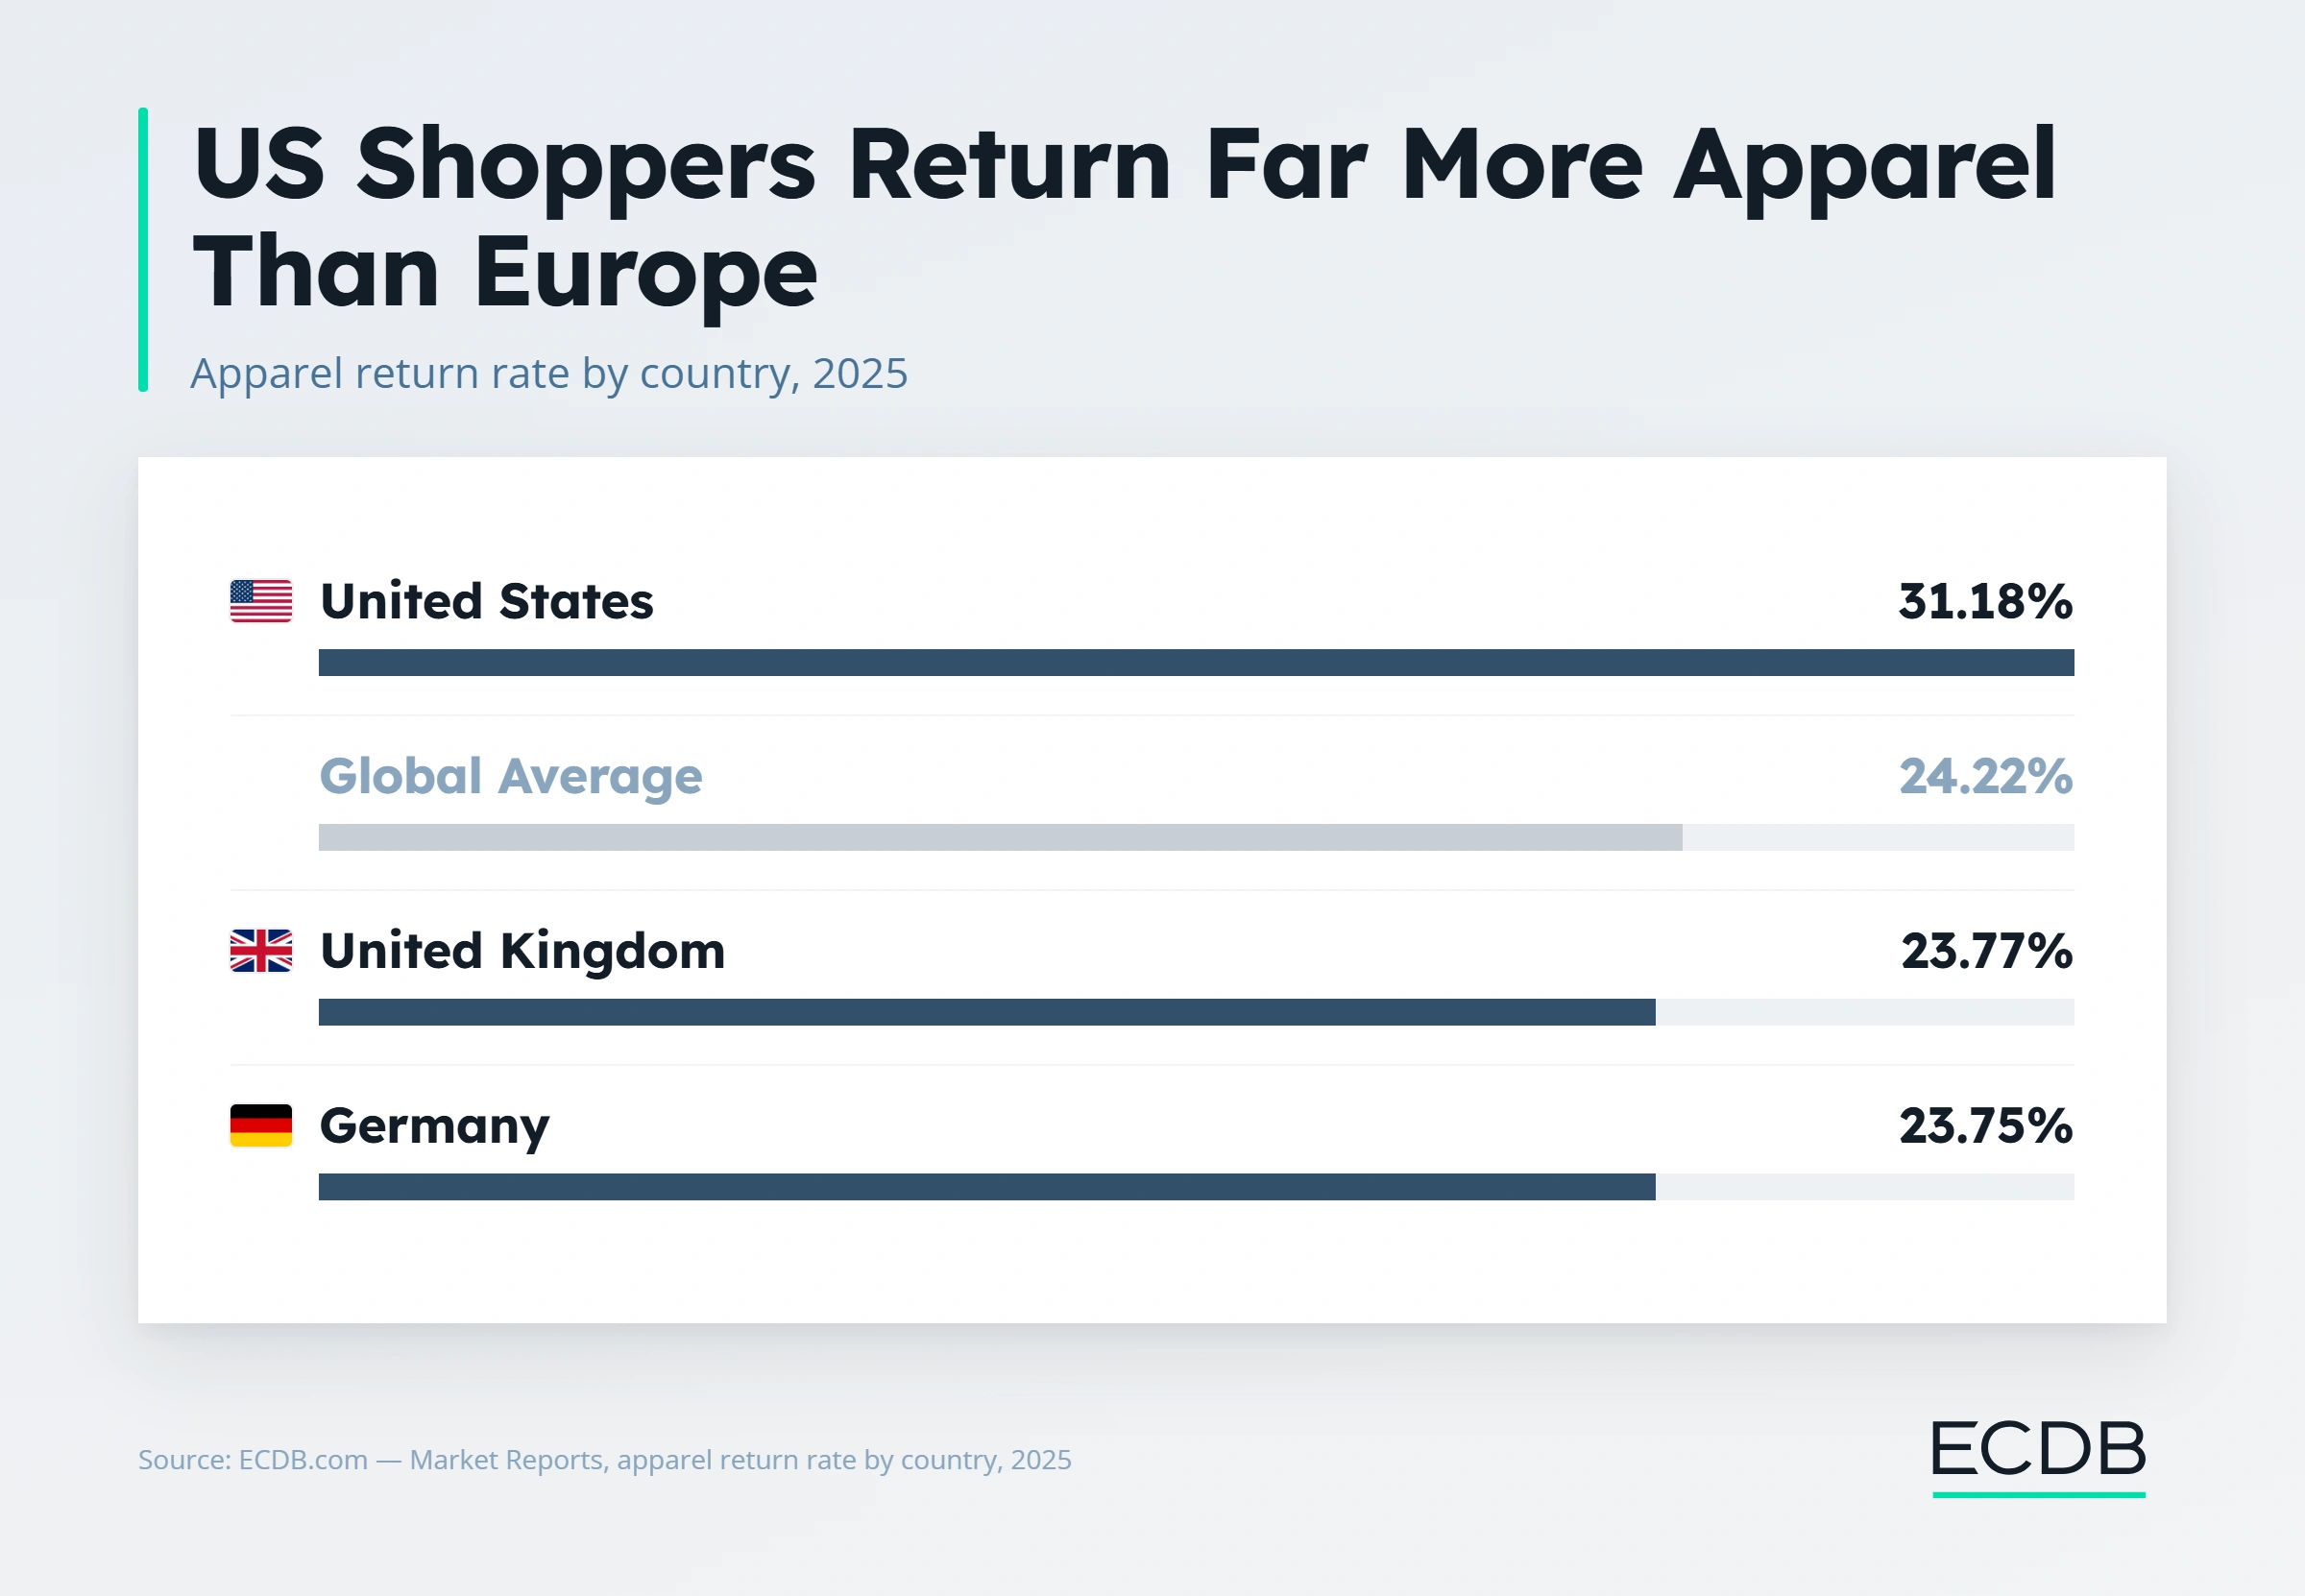
That gap tracks return policy norms as much as it tracks anything about the product itself. Markets where free, no-questions-asked returns are the competitive standard see more bracketing-style ordering, because the cost of over-ordering and sending back the rest falls entirely on the retailer.
Where returns are stricter or carry a fee, shoppers order more carefully to begin with, and the return rate reflects that difference.
What Return Rate Means for a Business's Real Margin
A high return rate changes what other metrics actually mean. An order that gets returned still shows up in revenue and conversion figures the moment it's placed, then disappears from actual, kept revenue once it comes back.
A category or a retailer with strong AOV and conversion numbers can still be a weaker business than the dashboard suggests if a large share of those orders don't stay sold.
That makes return rate a number worth checking alongside AOV and conversion rate, not after them. A fashion retailer with an impressive average order value is working with a smaller real number once close to a quarter of that value gets sent back.
How to Actually Reduce Returns, Matched to the Category
The fix depends on why the category returns in the first place, not a generic "improve product quality" instruction:
For fit-dependent categories like Apparel and Footwear: detailed, brand-specific size guides, fit information from other buyers with a similar body type, and consistent sizing across product lines all reduce the uncertainty that drives most fit-related returns.
For considered, high-AOV categories: clear, complete product descriptions and specifications reduce returns driven by mismatched expectations rather than fit.
Across any category prone to bracketing: return policies can stay generous where they need to for conversion, while still using purchase history to identify and address serial over-ordering rather than treating every return the same way.
Matching the fix to the actual reason behind the return is what separates a strategy that lowers the rate from one that just adds friction to every checkout.
How ECDB Grounds a Return Rate Strategy in Real Data
Every figure in this article, by category, subcategory, and country, comes from data ECDB tracks across more than 18,000 categories and thousands of stores. That makes it possible to check a category's real return rate before setting a return policy or judging whether a competitor's AOV advantage is actually worth as much as it looks.
The data is available through Profiles for any category, subcategory, or market worth benchmarking return rates against.
Related Articles
All ArticlesReady to Unlock the Full Power of ECDB?
Book a demo to see how ECDB's market intelligence can support your business.