Online Maturity Explains Why Consumers Buy More or Less Often
The United States lead with a purchase frequency of around 28 times in a year. At the same time, almost 1 in 5 US retail dollars is made online. Here is why.

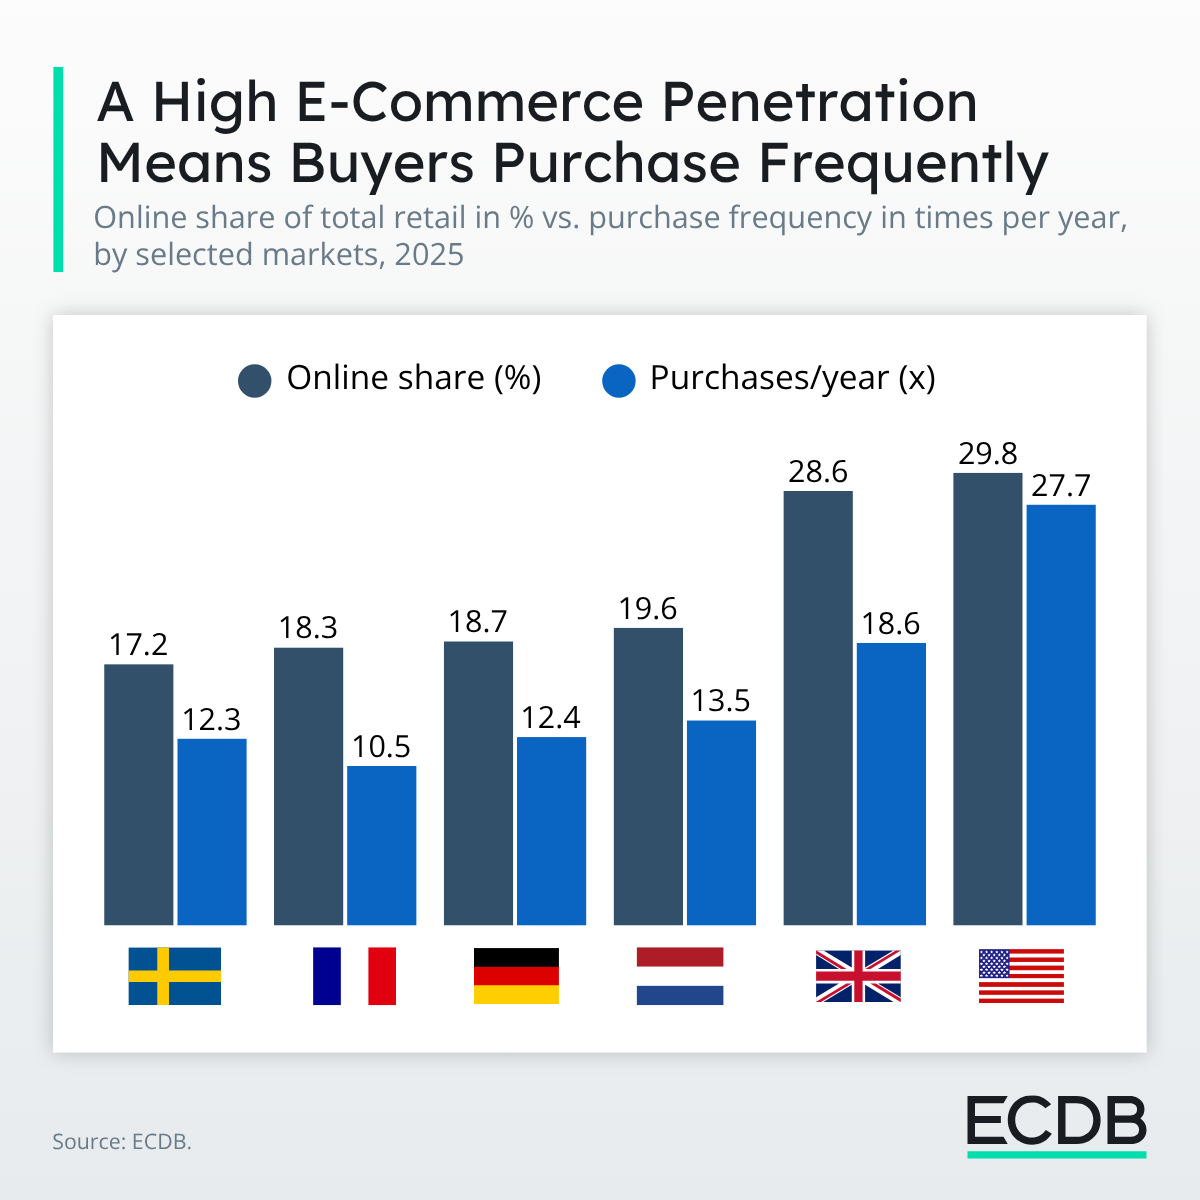
Purchase frequency measures how often the average shopper buys online in a year. At the same time, this metric is one of the sharpest ways to compare e-commerce markets with each other.
It captures something revenue alone cannot: whether shoppers treat online buying as a habit or an occasional errand. In the US, consumers buy online almost 28 times a year, by far the highest frequency of any market in this sample.
The gap is not small. US shoppers buy more than twice as often as their counterparts in the Netherlands, and more than four times as often as consumers in Sweden. Here is what correlates with that metric: online penetration.
Maturity and Frequency Go Hand in Hand
Online share measures the portion of total retail spending that happens online rather than in stores. The higher that share climbs, the more a market's everyday shopping behavior has already shifted from aisles to screens, and the more often consumers return to buy again.
E-commerce moves fast in the United States, and so do its consumers. Online penetration in the US has reached almost 22% as a result. Roughly one in five purchases is already made online. At that level, buying online is no longer a separate decision from buying at all. It is simply how a large share of US retail happens by default, and that default status shows up directly in how often people click "Buy."
US shoppers buy online far more often than their peers in the United Kingdom, the Netherlands, or Germany, each of which sits meaningfully behind the US on both online share and purchase frequency.
Amazon's Role in Setting the Pace
Does Amazon have something to do with it? Probably. No single retailer has done more to compress the distance between wanting something and owning it. Two-day delivery became one-day delivery, and in some categories same-day. Subscribe-and-save turned recurring household purchases into a default rather than a decision. One-click ordering removed the checkout step almost entirely.
Each of these changes lowers the barrier between browsing and buying. A purchase can become a package within a day.
Once shoppers learn that buying online is fast, reliable, and low-effort, they stop rationing their purchases into occasional large orders and start buying the way they'd pick something up at a corner store: whenever they need it, without much friction, and again in a few days for whatever they need next. That behavior, repeated across a market as large as the US, is what pulls the national frequency average so far ahead of its peers.
Longer Delivery Times, Lower Frequency
The other markets in the sample show a clear penetration-frequency relationship. Each sits behind the US on both counts, and each does so by roughly the same proportion.
The United Kingdom follows the United States at 18.5 purchases a year and an online share of 23.4%.
The Netherlands follows at 13.5, a smaller market where online retail sits at a share of 16.5%.
Germany has a frequency of 12.4 and a penetration of 18.7%.
Sweden looks different from the rest of the sample, and not only because it sits near the bottom of the frequency ranking. At an online share of 14.5%, Swedish consumers buy 12.3 times a year, and rural dispersion implies longer delivery times in many cases.
Sweden's population is spread thinly outside a small number of urban centers, a geography that makes the kind of one-day delivery Amazon built its US reputation on far harder to replicate nationwide.
Where delivery takes longer and costs more to arrange, shoppers tend to consolidate their needs into fewer, larger orders rather than buying piecemeal. The result is a market with respectable online share but a purchase rhythm that looks nothing like the US's.
Wrap-Up: Frequency Follows Convenience
Shorten the distance between browsing and buying, and frequency takes care of itself. The US just got there first, helped by a large, dense, digitally mature consumer base and a retail ecosystem, led by Amazon, that has spent two decades removing friction from the buying moment one step at a time.

Related Articles
All ArticlesReady to Unlock the Full Power of ECDB?
Book a demo to see how ECDB's market intelligence can support your business.