Purchase Frequency Reveals a Different Side of Central European E-Commerce
Austrian and German online shoppers purchase most frequently in a year, while other markets reveal different purchasing habits. Greece is one of the cases where frequency does not match revenue. Here are the specifics.

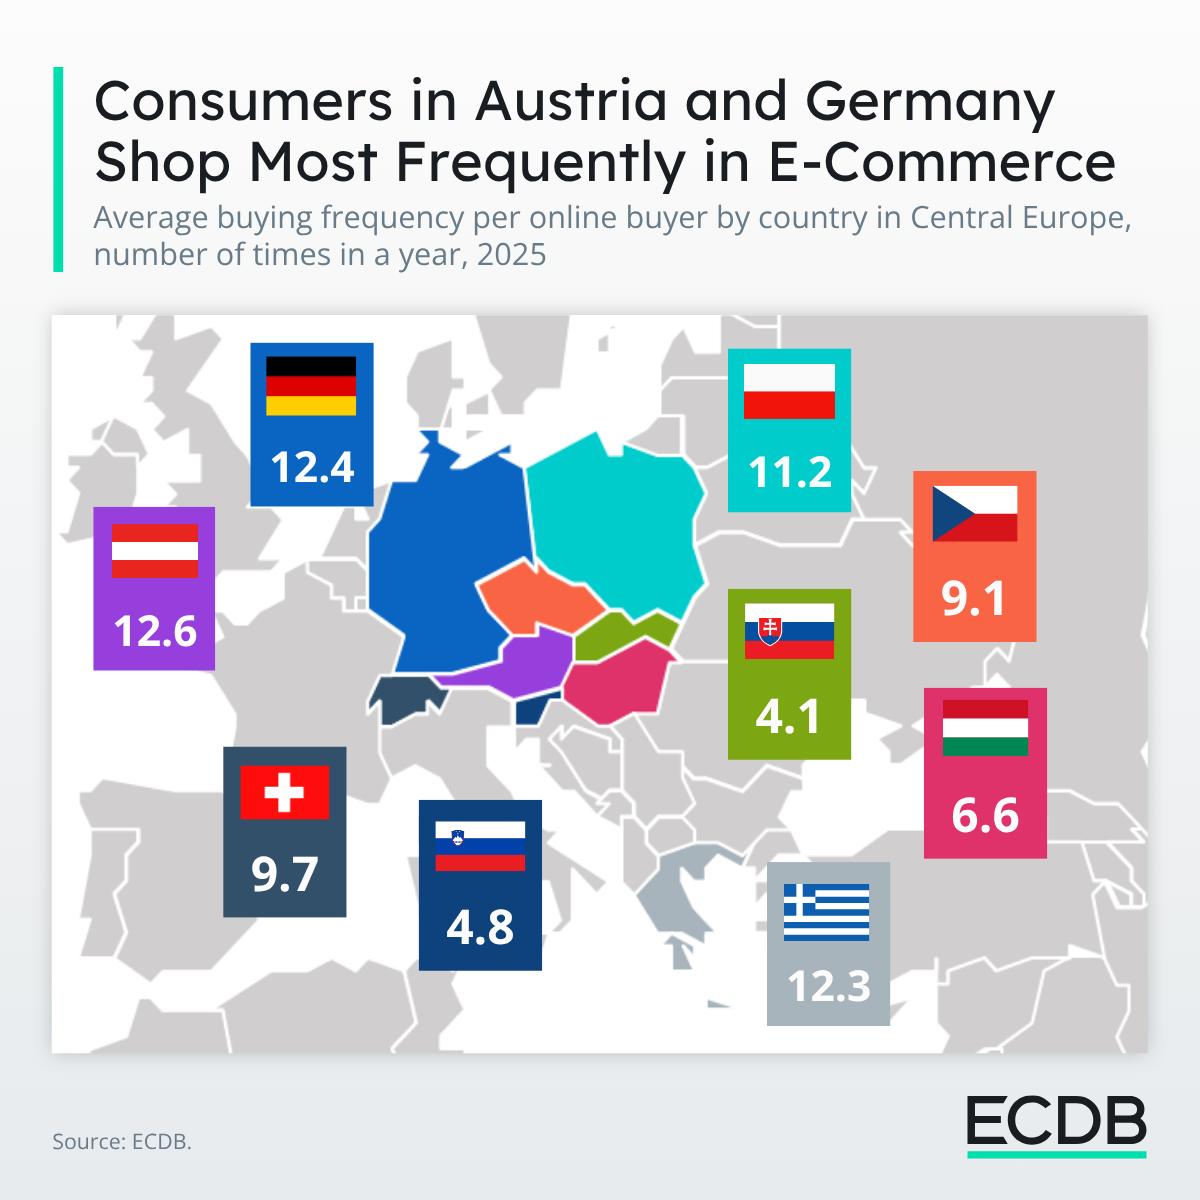
Central European e-commerce is as diverse as its markets, and one metric captures that diversity better than most: purchase frequency, or how often the average online buyer orders in a year.
Mapped across nine Central European markets in 2025, the figures tell a different story than revenue alone.
Austria, Germany and Greece in the Lead
Austria and Germany sit at the top of the chart, with online buyers there placing 12.6 and 12.4 orders a year respectively. Both are mature, high-penetration markets with dense, well-developed online retail, so a high purchase frequency is to be expected.
Greece does not fit that story. Online penetration there sits at just 6.4% in 2025, among the lowest in the region, yet Greek buyers order 12.3 times a year on average. The country nearly matches Germany's rate in that regard.
The underlying market differs in two important ways, however. Germany has a far larger buyer base than Greece, at 62.5 million online buyers versus 6.99 million, and its average basket size is bigger too, at €120 versus €83.
Greek buyers order almost as often as German ones. They simply spend less each time, and there are far fewer of them doing it.
Contrasting Patterns: Poland and Switzerland
A similar pattern shows up in Poland. Its 26.5 million online buyers, the second-largest buyer base in the group after Germany, shop at a frequency of 11.2 orders a year, close to the leading markets, but at a noticeably lower AOV of €79.
A large and active buyer base does not necessarily mean a market has caught up on basket value.
Switzerland contrasts this pattern entirely. Purchase frequency there is comparatively low, at 9.7 orders a year, and the buyer base is small, at 7.6 million. But its AOV is the highest in the region by a wide margin, at €214.
A high spend per order is made possible by the highest income level in the region, and it is a matter of shopping habit as much as income: buy less often, but spend considerably more per order when you do.
Slovakia and Slovenia Are Still Catching Up
At the other end of the spectrum, Slovakia and Slovenia post the lowest frequencies in the region, at 4.1 and 4.8 orders a year. Combined with small buyer bases and the lowest AOVs in the group, both markets point to e-commerce ecosystems that still have room to mature.
Hungary and Czechia sit in between the two extremes, with Czechia's frequency of 9.1 orders a year closer to Switzerland's pace, and Hungary's 6.6 landing nearer Slovenia's end of the spectrum.
A Combination of Wins: Austria and Germany
Purchase frequency does not track cleanly with online share, market size, or basket value on its own, as Greece and Poland both show.
Germany and Austria happen to lead on all three at once, buyer base, order frequency, and basket value, which is exactly why they top the list of Central European e-commerce markets rather than winning on any single measure alone.
Related Articles
All ArticlesReady to Unlock the Full Power of ECDB?
Book a demo to see how ECDB's market intelligence can support your business.