E-Commerce Return Rate by Category: Which Products Get Sent Back Most?
Fashion returns get sent back at more than four times the rate of the lowest category. The reason is deeply tied to user behavior.
Benchmark KPIs
The global average conversion rate in e-commerce sits at 2.68%. Compared across markets and categories, this figure swings from below 2% to above 4%. What counts as a good conversion rate depends entirely on where a business sells and what it sells.

Nadine Koutsou-Wehling
Data Journalist
July 21, 2026
Transactions
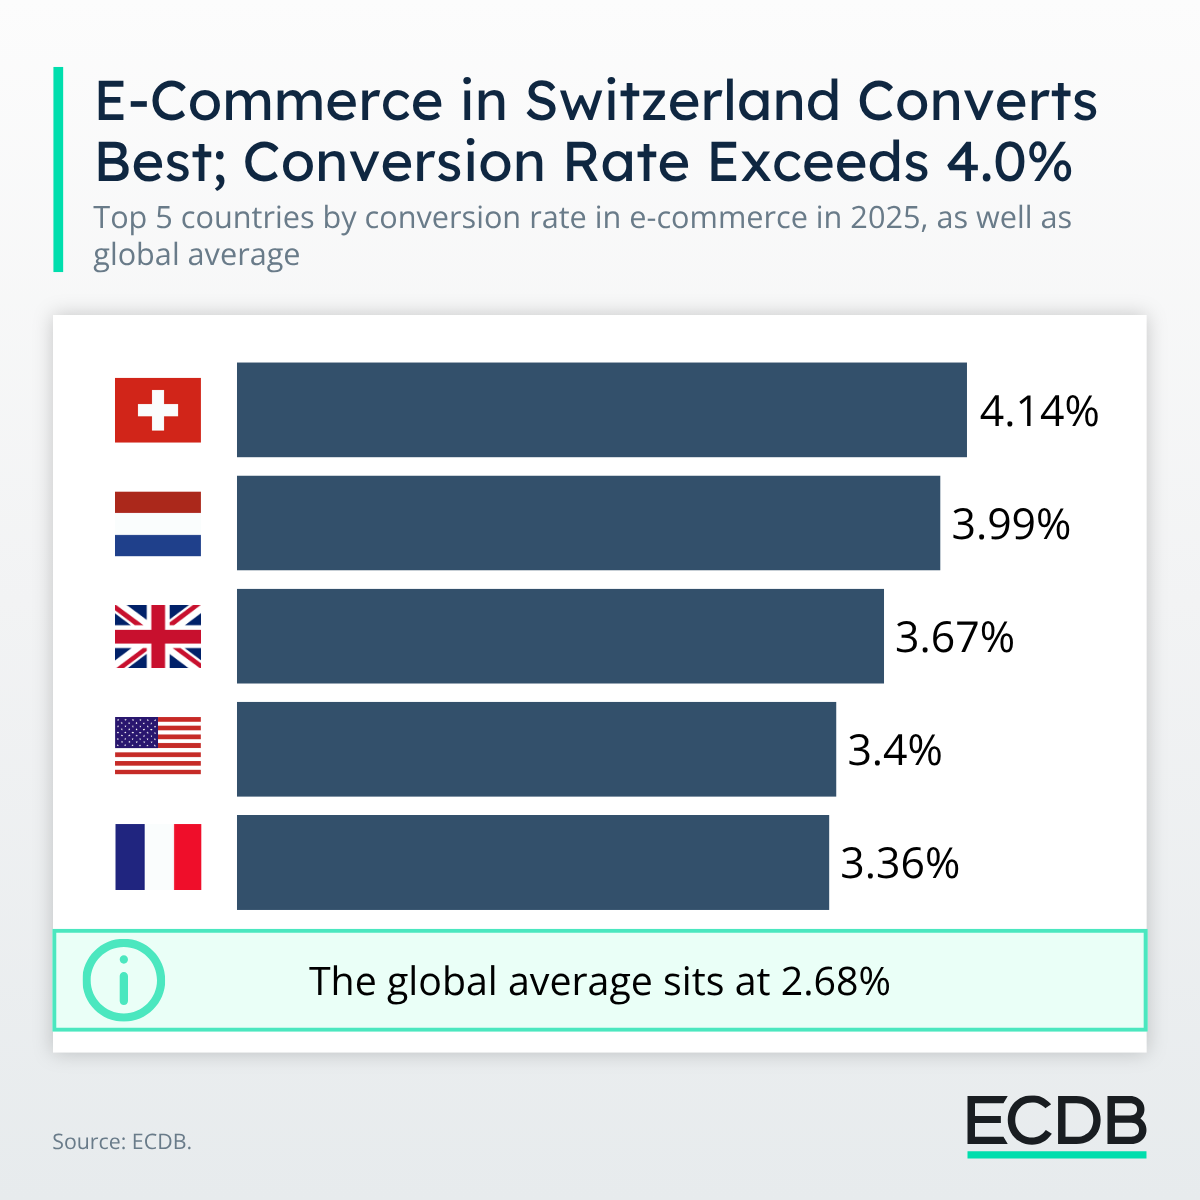
The global average conversion rate in e-commerce sits at 2.68%. On its own, that figure is close to useless. A business that treats it as a universal benchmark risks celebrating mediocre performance in one market while writing off a genuinely good result in another.
Context matters when benchmarking performance. In that sense, two variables do most of the work: where a business operates, and what it sells.
A 3.36% conversion rate is a solid result for a French online shop. In Switzerland, the same number would fall well short of the market standard.
In our ECDB database, Switzerland is the highest converting e-commerce market by a clear margin, 4.14%. High disposable income plays a central role: Swiss consumers have more money earmarked for online spending and hesitate less at checkout than shoppers in most other markets.
The Netherlands follows a similar logic, converting at 3.99%. Despite its small population, the Dutch market supports a dense field of domestic players.
One name in particular stands out: Bol.com, the Dutch retailer that entered the market early and built a broad third-party marketplace around it, ranks as the country's top online store, ahead of Amazon's local site. That kind of domestic dominance builds the convenience and familiarity that show up directly in conversion data.
The United Kingdom (3.67%), the United States (3.40%) and France (3.36%) round out the current top five. All five markets share the same underlying traits of high income, trust in online retail and low purchase friction.
Product category shifts conversion rates just as sharply as the location of operation, and for different reasons.
Grocery converts highest of any major category, at 4.39%. These are frequent, low-consideration, repeat purchases. Buyers already know what they want and how much it costs, so there is little reason to hesitate.
Furniture & Homeware sits at the opposite end, at just 1.94%. Higher price points and longer research cycles mean shoppers browse, compare and delay before committing, and that deliberation shows up directly in the conversion figure.
A furniture retailer benchmarking itself against the 2.68% global average, or worse, against a grocery competitor's numbers, is measuring itself against the wrong yardstick entirely.
A conversion rate benchmark only holds up once it accounts for where a business sells and what it sells. Strip out that context, and the number can just as easily mislead as inform.
ECDB helps businesses find that specific benchmark that accurately tells them where they stand. In each of ECDB's Profiles, the benchmark KPIs are an integral part of the dataset. Or compare several KPIs across retailers and markets in Analyze & Compare.
Related Articles
Fashion returns get sent back at more than four times the rate of the lowest category. The reason is deeply tied to user behavior.
The United States lead with a purchase frequency of around 28 times in a year. At the same time, almost 1 in 3 US retail dollars is made online. Here is why.
Austrian and German online shoppers purchase most frequently in a year, while other markets reveal different purchasing habits. Greece is one of the cases where frequency does not match revenue. Here are the specifics.

Click here for
more relevant insights from
our partner Mastercard.
Book a demo to see how ECDB's market intelligence can support your business.