Average Conversion Rate for E-Commerce: What Is an Average Conversion Rate by Industry?
There is no single average. Conversion rates range from under 2% to nearly 4.5% depending on what's being sold. Ultimately, the pattern tracks price.

Article in a Nutshell:
Conversion rates range from 1.94% in Furniture & Homeware to 4.39% in Grocery across the seven top-level categories ECDB tracks, more than double from one end to the other.
The pattern runs opposite to price. Household Care converts at 3.5%, while Bullion & Precious Metal, a far more expensive category, converts at just 1.66%.
The same split shows up at the store level. Walmart converts visits at 3.38%, in line with everyday low-consideration goods, while Casper, selling a mattress people research for weeks, converts at 2.44%.
What is an average conversion rate for e-commerce? The honest answer is that averaging across all of e-commerce hides more than it reveals.
Conversion rate depends heavily on what's being sold, and it moves in the opposite direction from price. Categories where people buy quickly and often convert visits into orders at more than double the rate of categories where people buy rarely and think it over first.
The Rate Across the Seven Top-Level Categories
Conversion rate varies by more than 2x across the categories ECDB tracks at the top level:
Grocery: 4.39%
Hobby & Leisure: 3.21%
Care Products: 3.01%
Fashion: 2.39%
Electronics: 2.30%
DIY: 2.08%
Furniture & Homeware: 1.94%
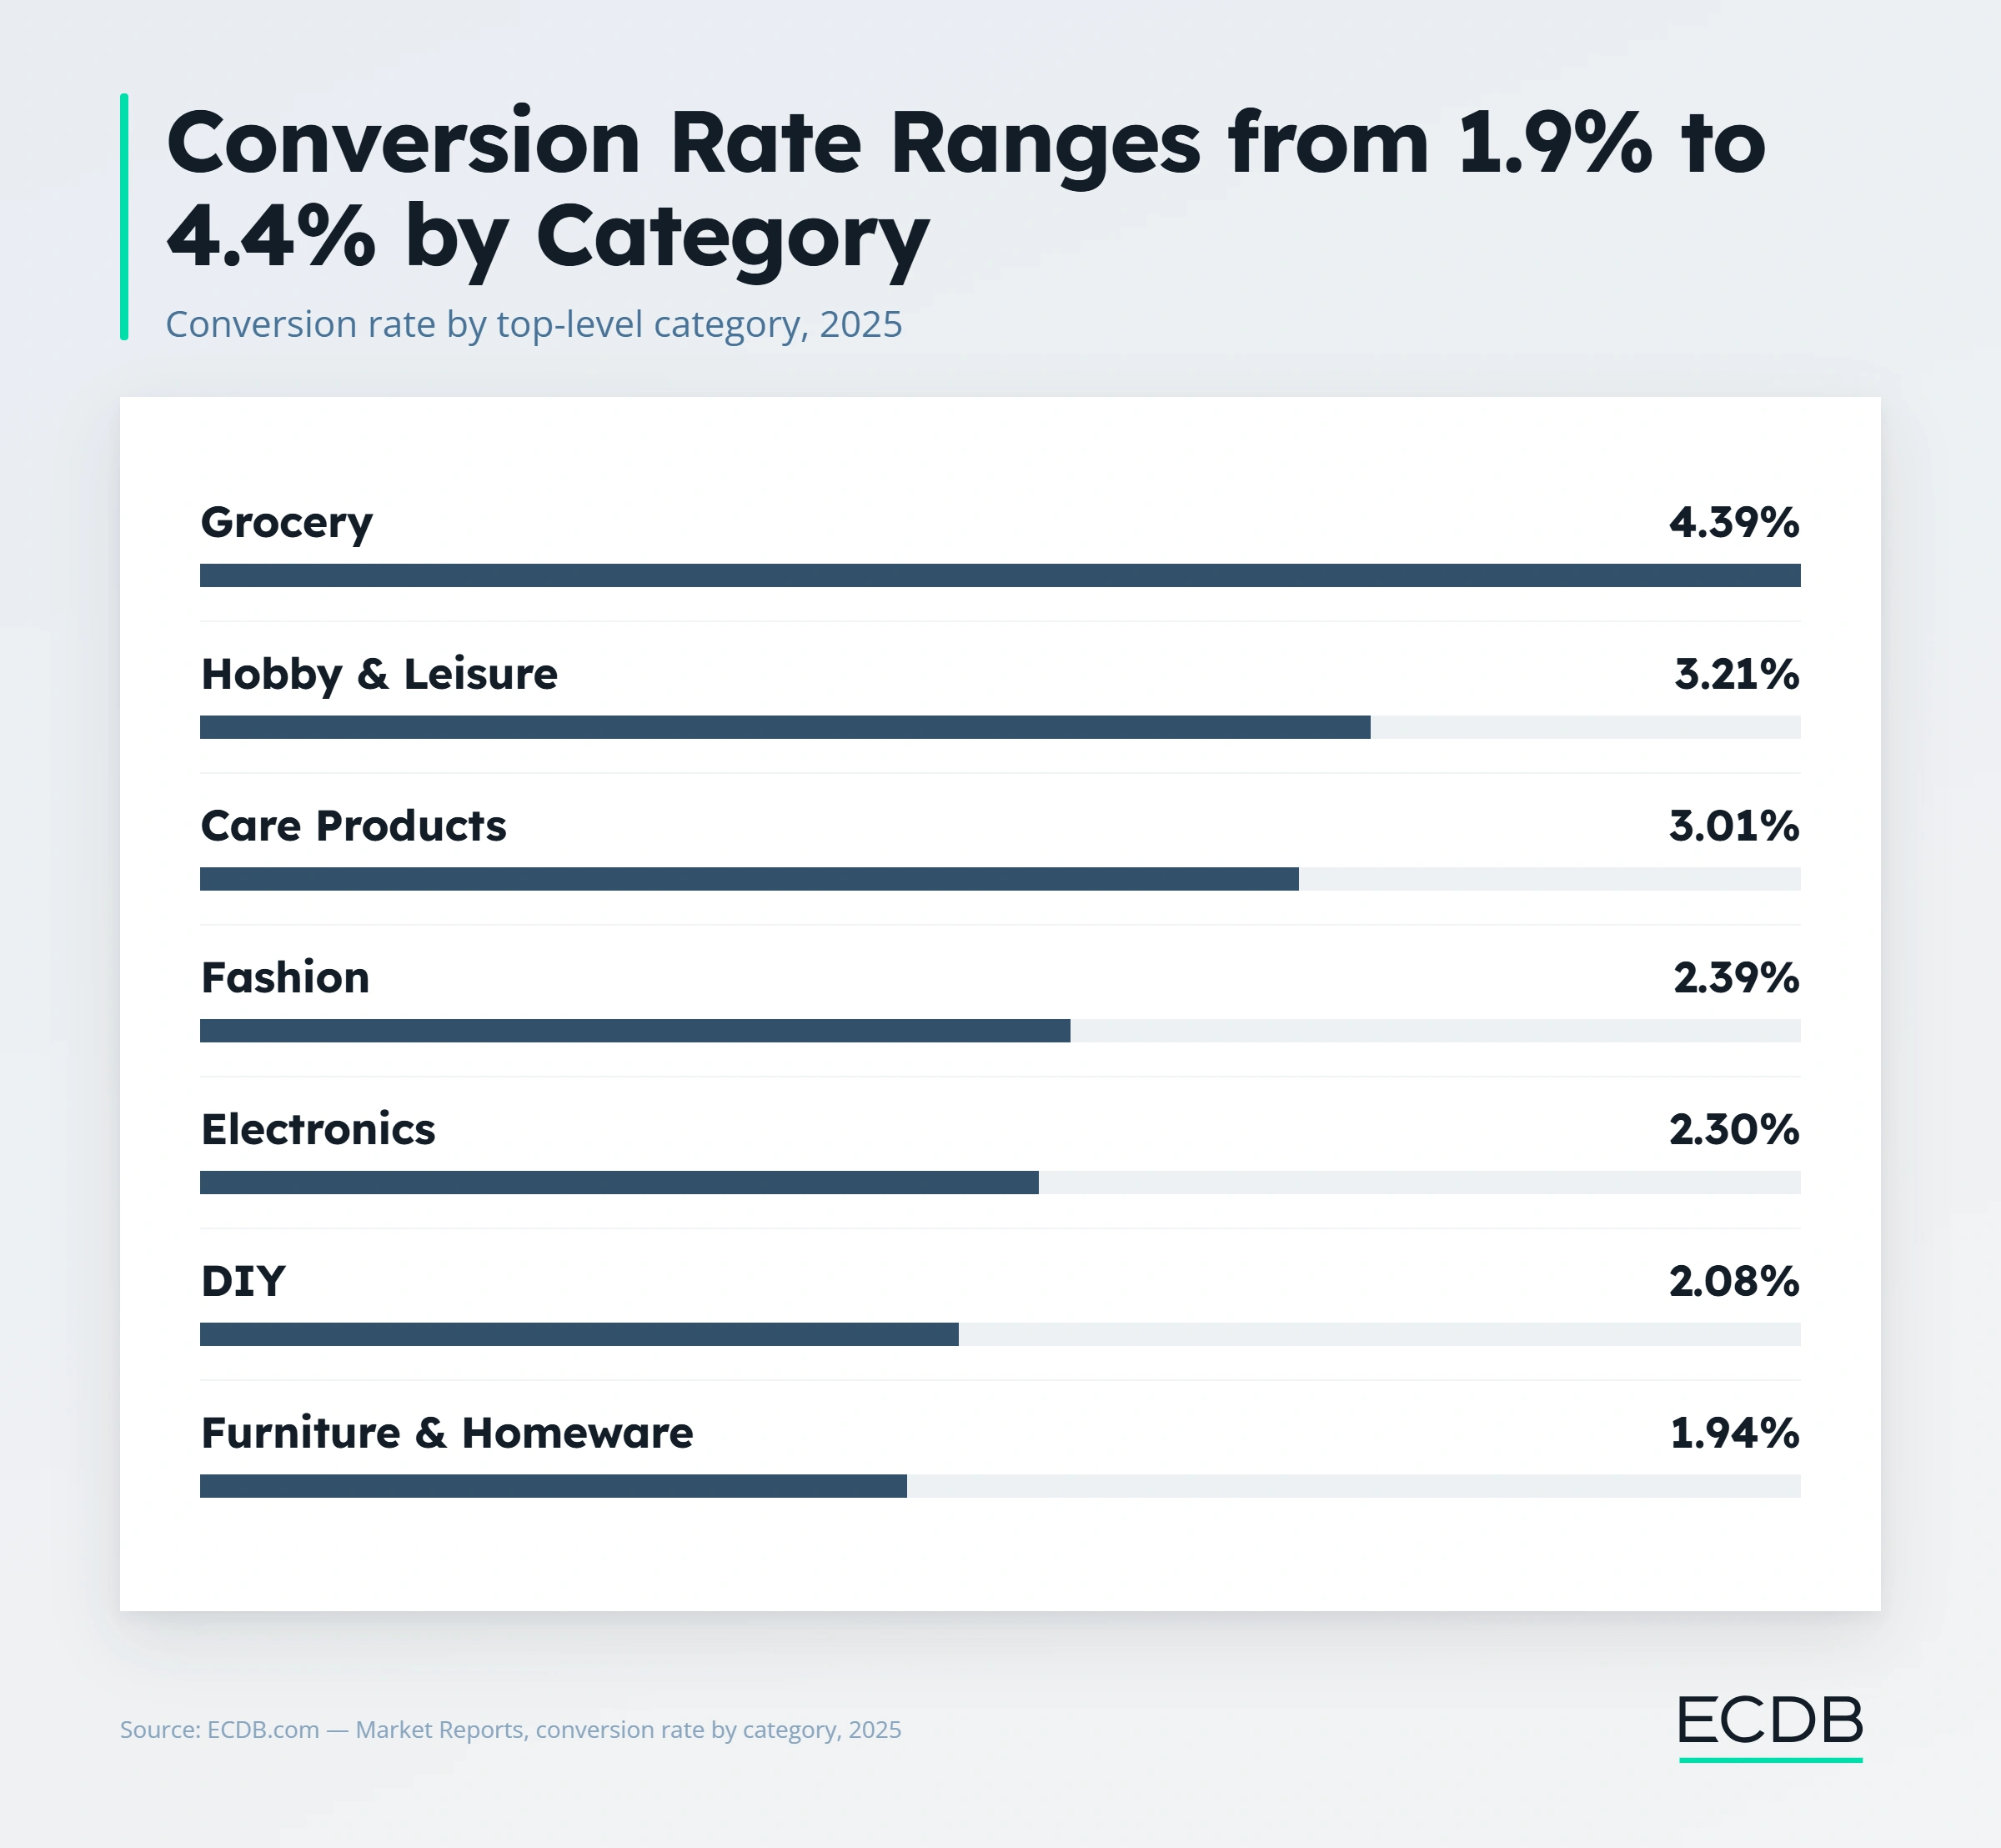
Grocery sits at the top because it's the least deliberated purchase on the list, people know what they need and buy it without much comparison shopping. Furniture & Homeware sits at the bottom for the opposite reason: a sofa or a dining table gets researched, compared, and often abandoned in a cart before a customer commits.
Why Conversion Rate Runs Opposite to Price
Conversion rate tracks how much thought a purchase requires, not how well a store is running. A previous piece in this series looked at Household Care and Bullion & Precious Metal as the two subcategories with the widest average order value gap, US$40.30 against US$574.44.
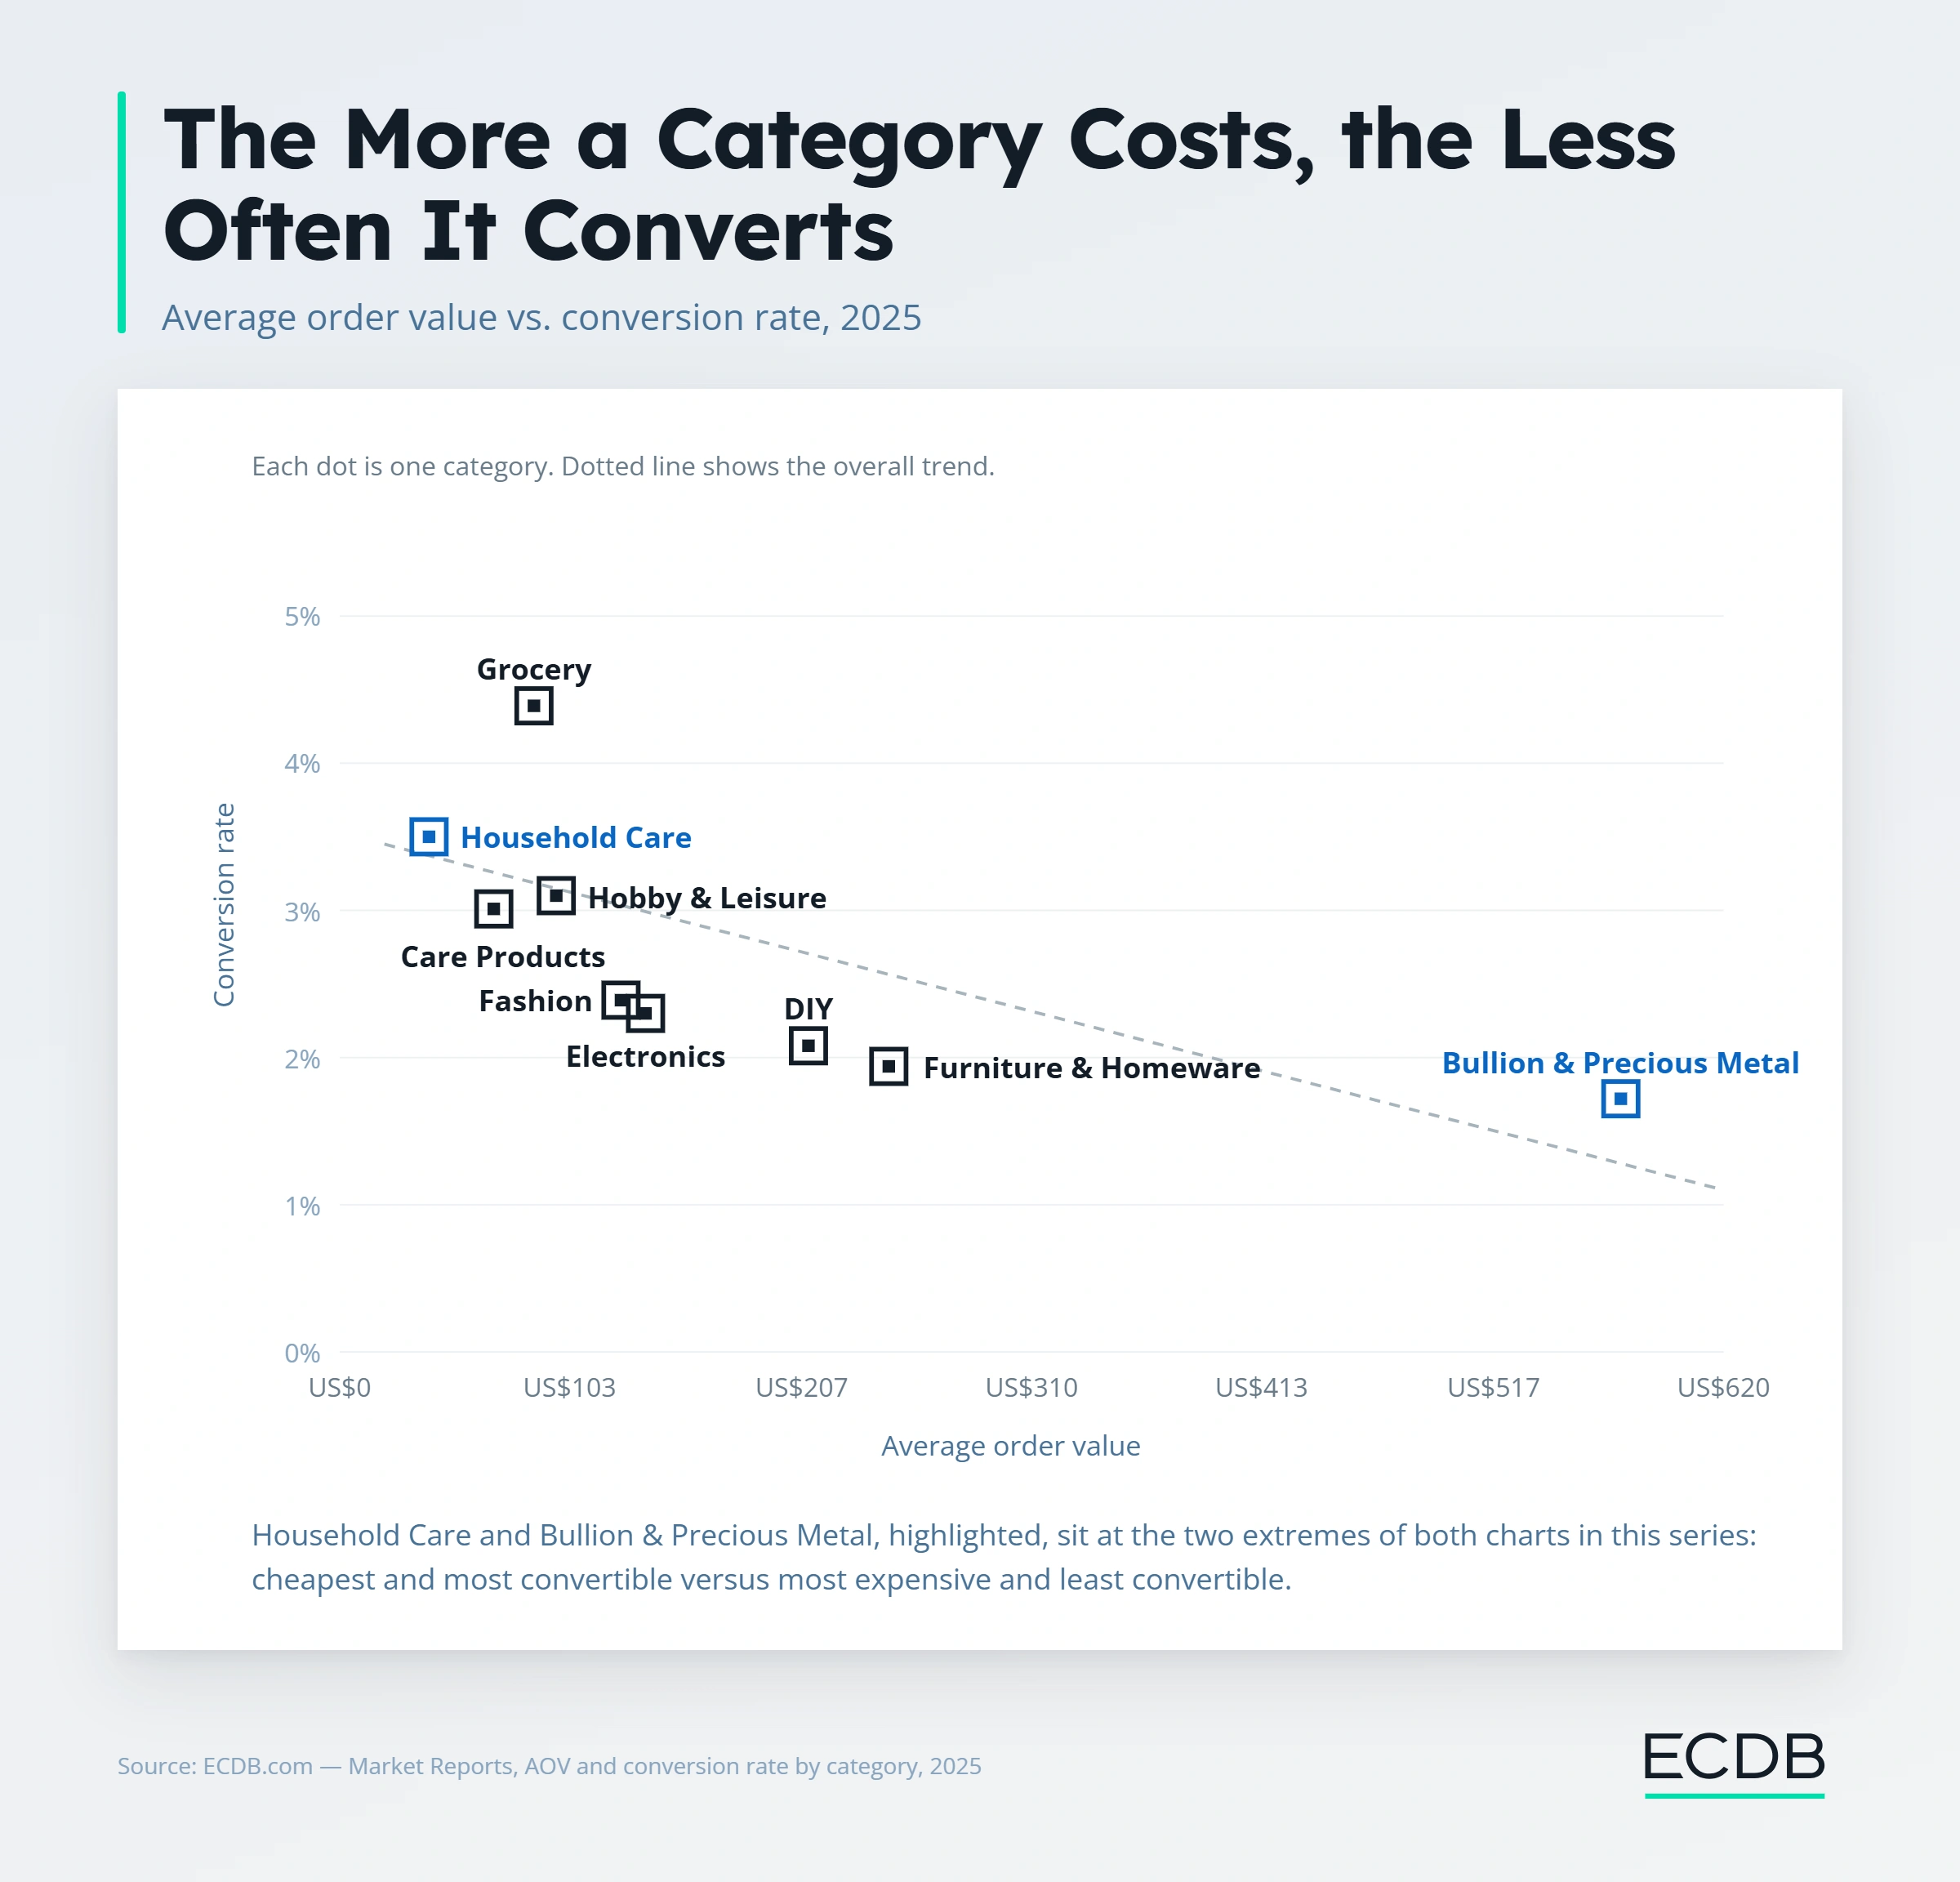
Those same two subcategories show nearly the widest conversion rate gap too, just flipped. Household Care converts at 3.5%, a routine, low-stakes purchase people don't think twice about. Bullion & Precious Metal converts at 1.66%, since a purchase that size usually gets researched, compared, and reconsidered before it happens.
Cheap, frequent purchases convert easily because there's little to decide. Expensive, rare purchases convert less often because there's a lot to decide, and plenty of chances to leave without buying on a first visit.
Average Website Conversion Rate: The Store Level
The category pattern holds inside individual stores, not just across broad industries. Walmart converts visits into orders at 3.38%, a rate that fits its everyday, low-consideration product mix. Casper, selling mattresses at a $588.00 average order, converts at 2.44%, lower than Walmart but still solid for a category where customers commonly browse for weeks before buying.
Neither number says one store is run better than the other. They're selling different kinds of decisions, and the conversion rate reflects that difference more than it reflects anything about site quality or checkout design.
What a "Good" Conversion Rate Actually Depends On
There's no universal benchmark worth chasing, and a generic "2 to 3% is good" rule of thumb breaks down the moment it's applied to the wrong category.
A 2.5% conversion rate would be disappointing for a Grocery store and good for a store selling furniture. The only benchmark that means anything is the category's own average, checked before judging whether a specific store's rate counts as good or bad.
How ECDB Grounds Conversion Rate Benchmarking in Real Data
Every figure in this article, at the top-level category, the subcategory, and the individual store, comes from data ECDB tracks across thousands of stores and more than 18,000 categories. That makes it possible to check the right benchmark before judging a conversion rate at all, instead of measuring every store against the same borrowed number.
Brands use this to compare a store's conversion rate against its actual category average rather than a generic industry myth, to check whether a low rate is normal for a considered-purchase category or an actual problem, and to see how a specific competitor's conversion rate stacks up within the same narrow subcategory.
That data is available through ECDB's Profiles and Category Explorer tools for any category, subcategory, or store worth benchmarking.
Related Articles
All ArticlesReady to Unlock the Full Power of ECDB?
Book a demo to see how ECDB's market intelligence can support your business.